David's Astronomy Pages (All Sky Camera)
Aurora on night 2017-11-07 / 2017-11-08
Aurora
2016-12-31
All Sky
Images
Home
Page
Aurora
2017-11-10
David's Astronomy Pages (All Sky Camera)
|
Aurora 2016-12-31 |
All Sky Images |
Home Page |
Aurora 2017-11-10 |
Aurora Notes
Pictures Videos Summary Plot Magnetometer Stack Plots (for reference) Planetary K-Index Plot (for reference) Aurora Forecast, NOAA/Ovation (for reference)
- Aurora display (KP6 event), unfortunately largely hidden by cloud & rain during peak activity (c. 23:20h UT). Aurora visible intermittently between 19:06 and 04:02 hUT. Strong activity noted at 22:26h UT.
Rain Shower at 19:30-20:00h UT, whose raindrops affect image quality in middle part of night.
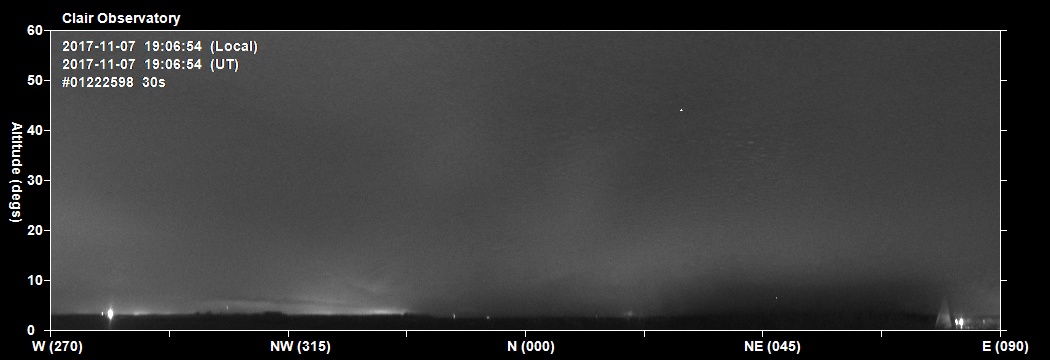
| Panoramic View - Northern Sky |
| Aurora / Cloud- 2017-11-07 19:06h UT (GMT). Image #1222598 |
 |
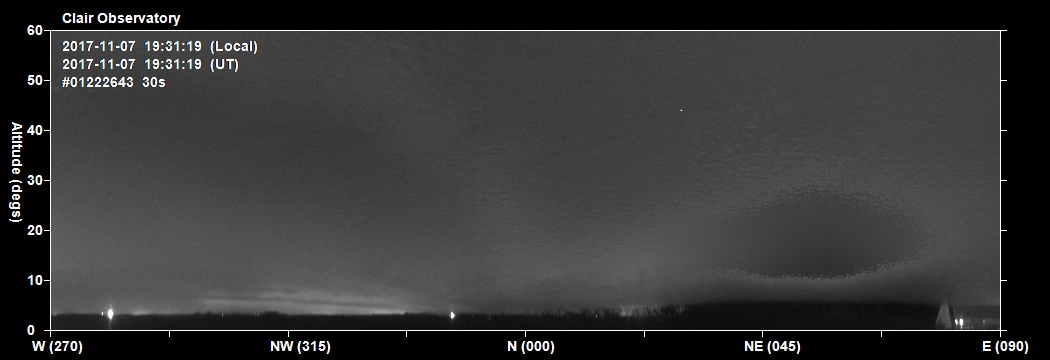
| Aurora / Cloud - 2017-11-07 19:31h UT (GMT). Image #1222643 |
 |
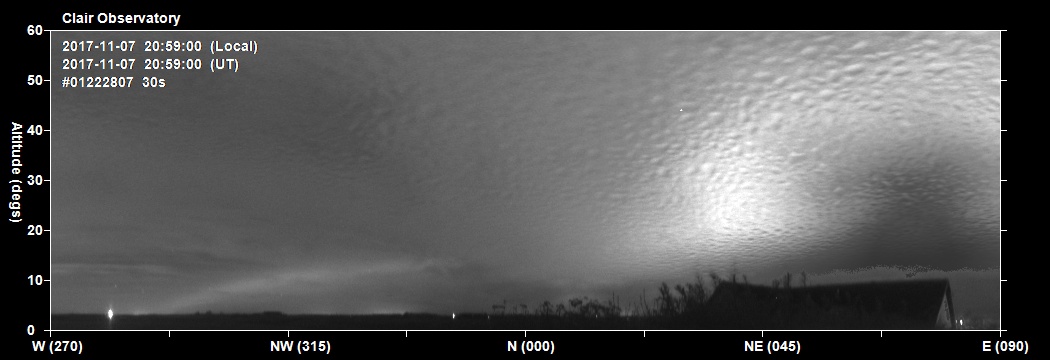
| Aurora / Cloud / Rain - 2017-11-07 20:59h UT (GMT). Image #1222807 (Images quality degraded by rain drops & condensation from this point onwards) |
 |
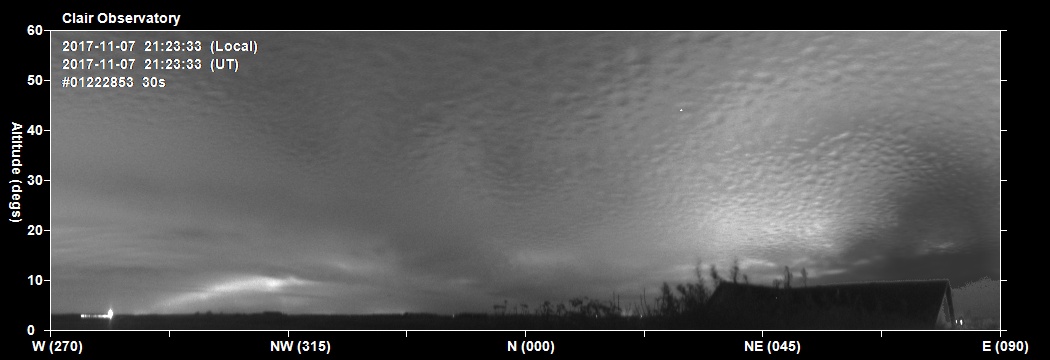
| Aurora / Cloud / Rain - 2017-11-07 21:23h UT (GMT). Image #1222853 |
 |
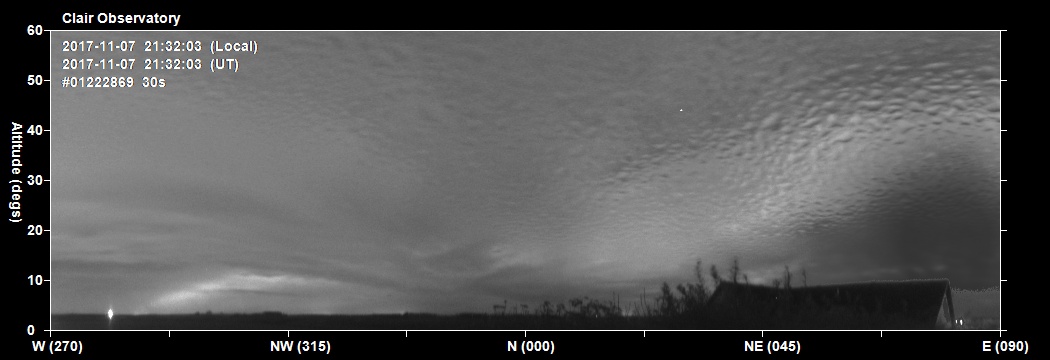
| Aurora / Cloud - 2017-11-07 21:32h UT (GMT). Image #1222869 |
 |
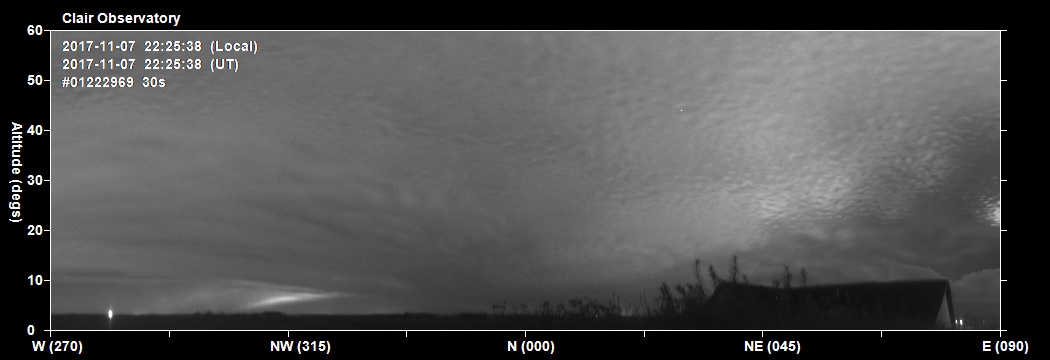
| Aurora / Cloud - 2017-11-07 22:25h UT (GMT). Image #1222969 |
 |
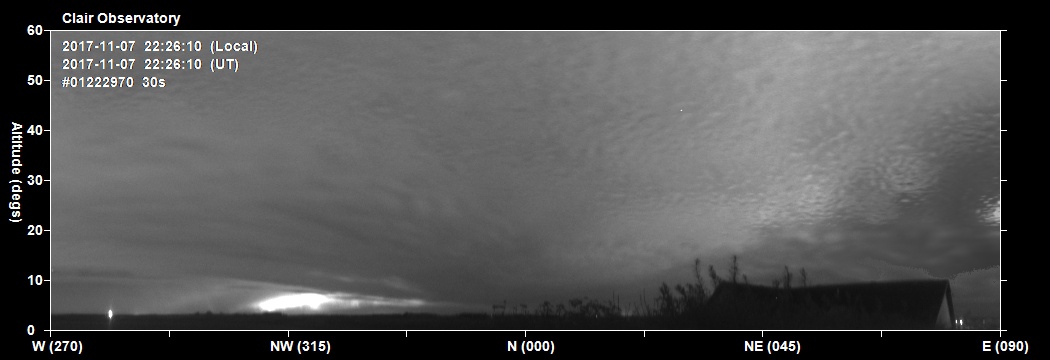
| Aurora / Cloud - 2017-11-07 22:26h UT (GMT). Image #1222970 |
 |
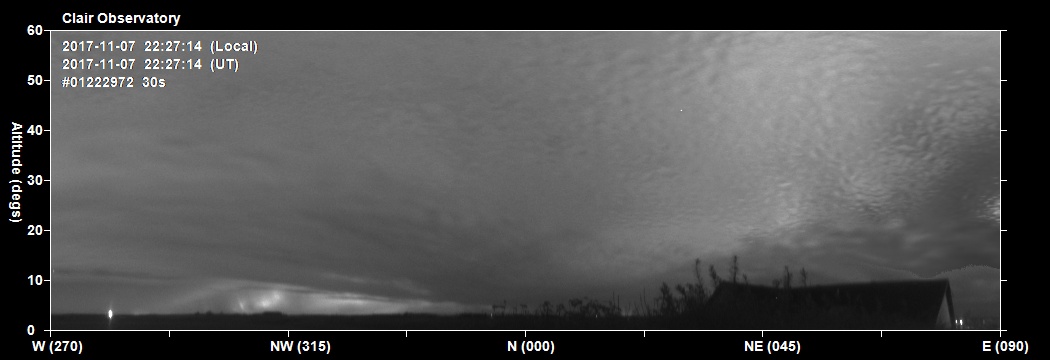
| Aurora / Cloud- 2017-11-07 22:27h UT (GMT). Image #122297 |
 |
| Aurora / Cloud - 2017-11-07 23:13h UT (GMT). Image #122297 |
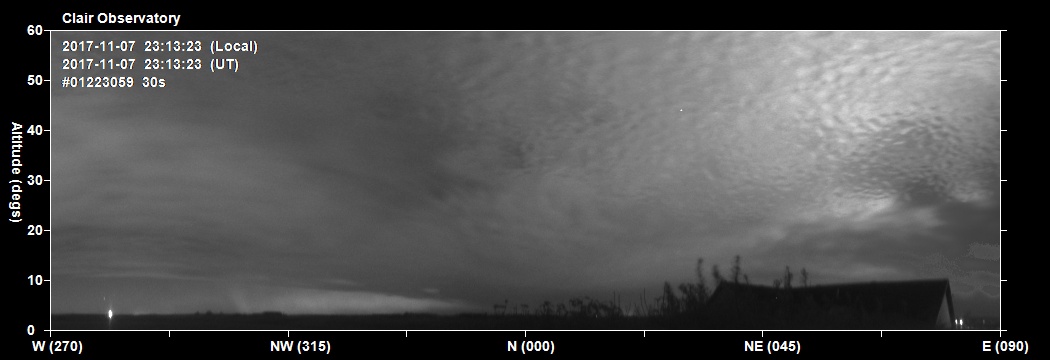 |
| Aurora - 2017-11-08 01:01h UT (GMT). Image #1223260 |
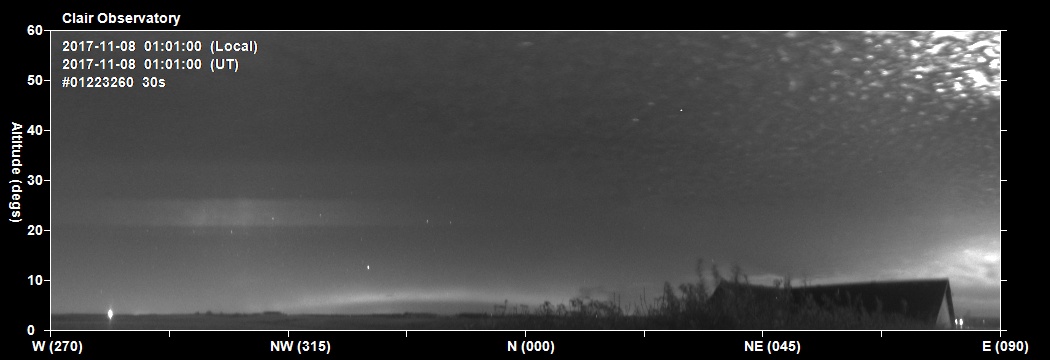 |
| Aurora - 2017-11-08 01:12h UT (GMT). Image #1223282 |
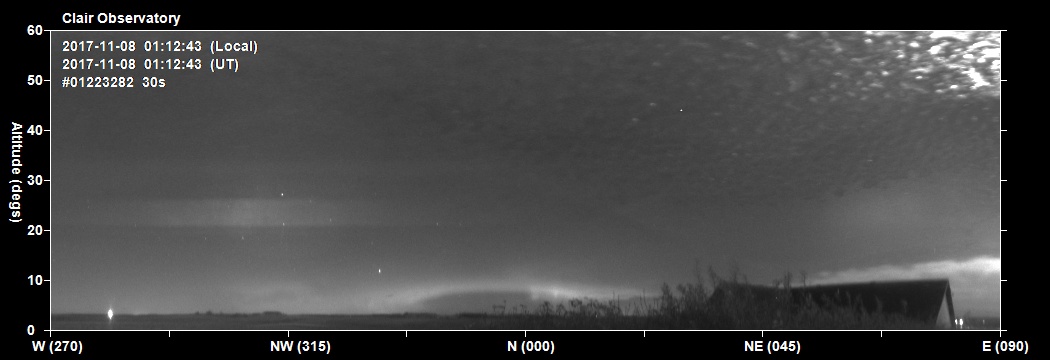 |
| Aurora - 2017-11-08 01:42h UT (GMT). Image #1223336 |
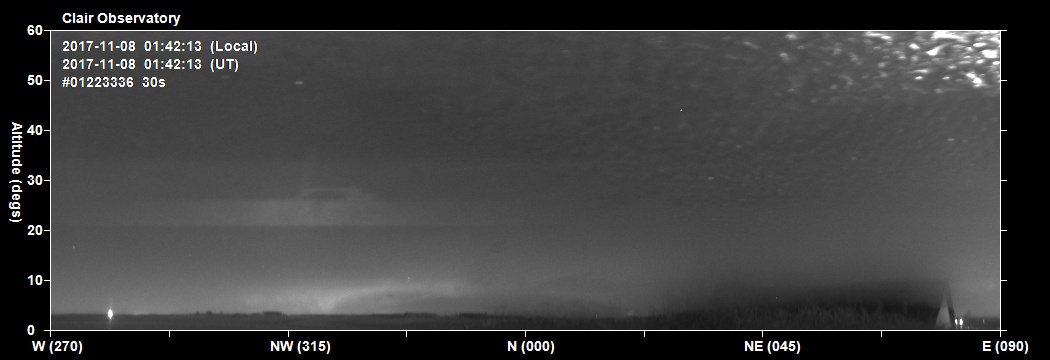 |
| AAurora - 2017-11-08 04:02h UT (GMT). Image #1223597 |
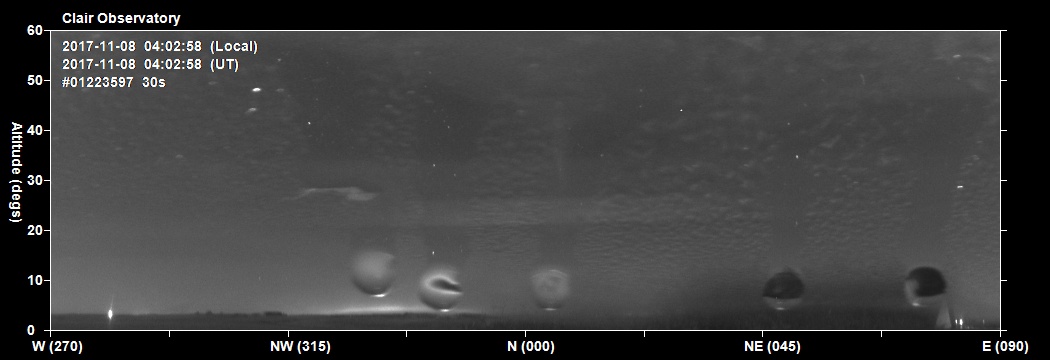 |
| Panorama views of northern sky converted from original fish eye
images 30s exposures taken with Oculus All Sky Camera |
Back to Top
| Video: North panoramic view, 9.5 hour period
2017-11-07 19:00h to 2017-11-08 04:30h UT (GMT), Frames 1222586-3647 |
| Link to .mp4 video file (3.4 MB) |
|
0.0s
/ 0.0s
|
Back to Top
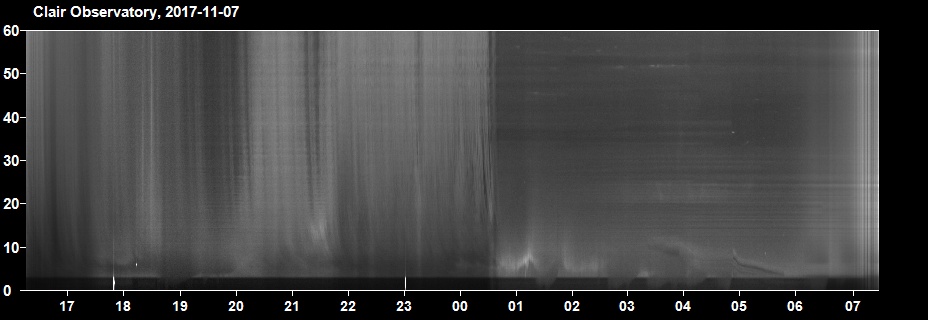
| Night Summary Plot - North Sky (2017-11-07 /
2017-11-08) Times on plot are local GMT times (= UT time) |
 |
Back to Top
| Magnetometer Stack Plots from Scandinavia
(ordered by latitude) H Component - 2017-11-07 / 2017-11-08 Original data from Tromsø Geophysical Observatory (TGO), DTU Space (Technical University of Denmark) and Finnish Meteorological Institute (FMI, displayed on SpaceWeatherLive http://www.spaceweatherlive.com/en/auroral-activity/magnetometers). Note: Geomagnetometer activity at rvk (Rorvik, 64.95N), dob (Dombas, 62.07N), sol (Solund, 61.08N) and kar (Karmoy, 59.21N) stations are used as indicators for potential auroral activity that may be visible from my Observatory situated at latitude 57.32N (Map of Stations) |
 |
|
|
Back to Top
|
Estimated 3 hour Planetary K-Index (NOAA) (K indices of 5 or greater indicate storm-level geomagnetic activity around earth) (from http://services.swpc.noaa.gov) |
 |
Back to Top
| Aurora Forecast at peak of Aurora storm, 2017-11-08 01:00h UT for 01:25hUT |
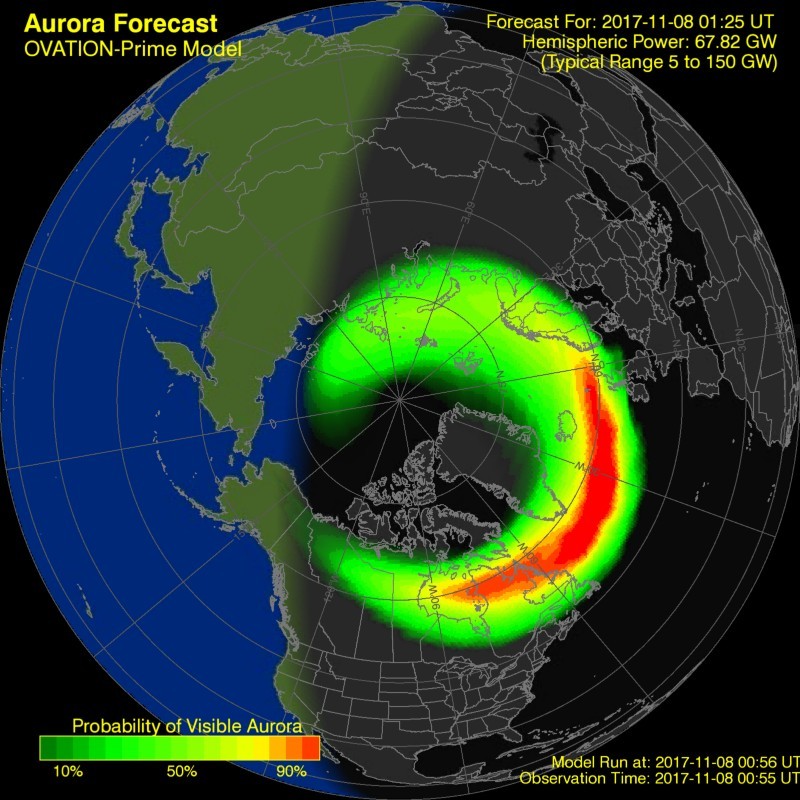 |
| From Space Weather Prediction Centre, http://www.swpc.noaa.gov |
Back to Top
| This Web Page: | Aurora - 2017-11-07 / 2017-11-08 |
| Last Updated : | 2023-03-29 |
| Site Owner : | David Richards |
| Home Page : | David's Astronomy Web Site |