David's Astronomy Pages (Projects)
Extrasolar Planet Transits
Extrasolar
Stars
Projects
Home
Page
Nearby
Stars
David's Astronomy Pages (Projects)
|
Extrasolar Stars |
Projects |
Home Page |
Nearby Stars |
This page summarises attempted observations of extrasolar planet transits
(this is where an extrasolar planet can be detectable as a small brightness decrease
during the regular transit of the planet across it's host star/sol)
HAT-P-12 b Transit (2019-02-26) XO-2b Transit (2009-11-08) HD 209458b Transit (2006-08-08) - Attempt 
>> ExtraSolar Planet Stars
|
HAT-P-12 b exoplanet (Canes Venatici) |
|
HAT-P-12 b, discovered
by Hartman et al, 2009
http://adsabs.harvard.edu/abs/2009ApJ...706..785H is an exoplanet that orbits the star HAT-P-12 approximately every 3.21 days The image below was taken whilst HAT-P-12 was undergoing a transit by the exoplanet and is part of a series of images that taken together show a small but diagnostic reduction in the brightness of the host star during the transit. Mass 0.211 MJupiter, radius of 0.959 RJupiter , mean density of 0.295 g cm-3. Period = 3.2130598 ± 0.0000021 d, transit epoch Tc = 2454419.19556 ± 0.00020 (BJD) HAT-P-12 lies at a distance 464 light years (142.5 parsecs), is K4 Dwarf with mass 0.73 Msun |
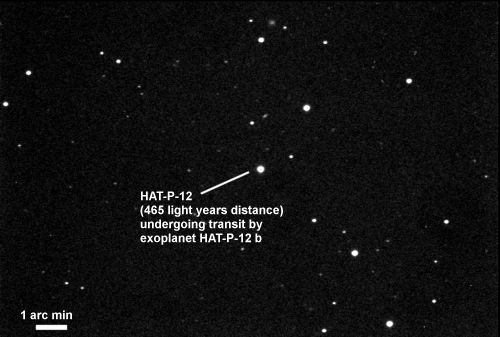 |
| Annotated CCD Image (70% size) 10 x 30s exposure (average combine), 3x3 binning, Xo Filter 2019-02-27 01:03 UT (#669402-11) 12" LX200R (at f/10.4) + ST-10XME Auto-guided using TS 80mm APO, ZWO ASI178MC & PHD2 |
|
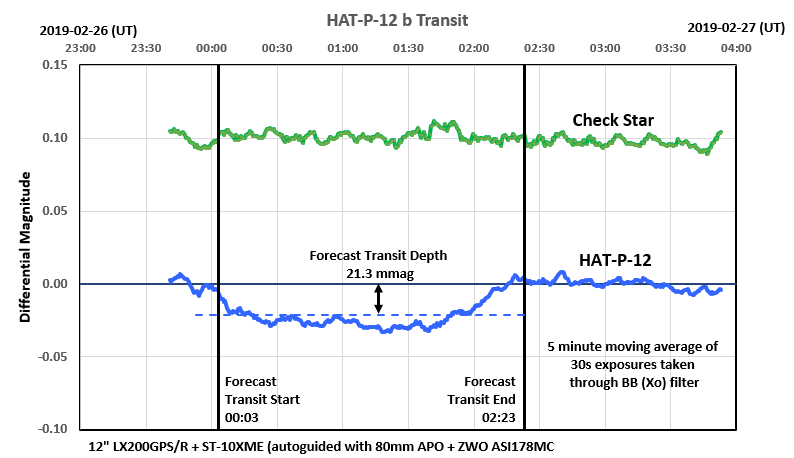
Summary Light Curve showing transit of HAT-P-12b 2019-02-27 00:03 to 02:23 UT Data collected (420 x 30s frames) demonstrate a clear dip in the brightness of host star HAT-P-12 that corresponds with the forecast time and depth of the transit by exoplanet HAT-P-12 b. (timings from Transit Finder Tool on https://astro.swarthmore.edu ) |
 |
|
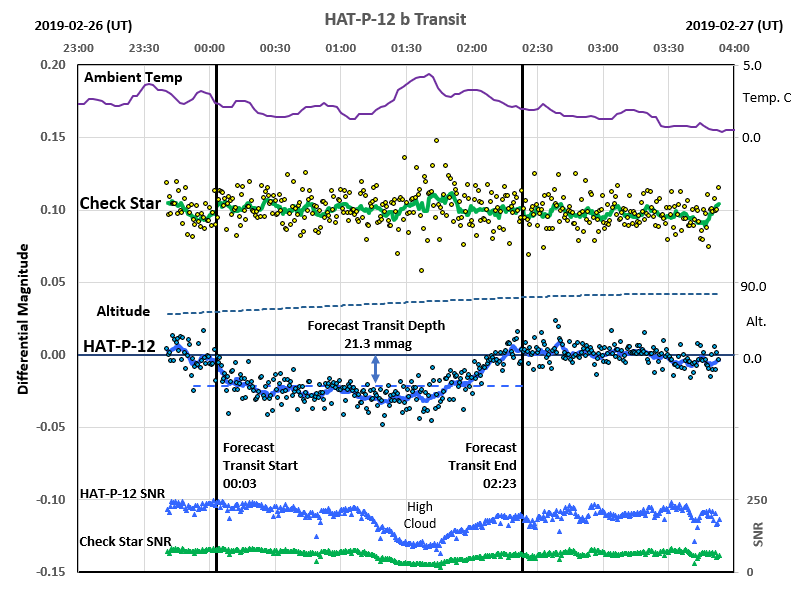
Detailed Light Curve showing transit of HAT-P-12b 2019-02-27 00:03 to 02:23 UT with various environmental & supporting information |
 |
|
420 x 30s frames collected between 2019-02-26 23:40 & 2019-02-27 03:53
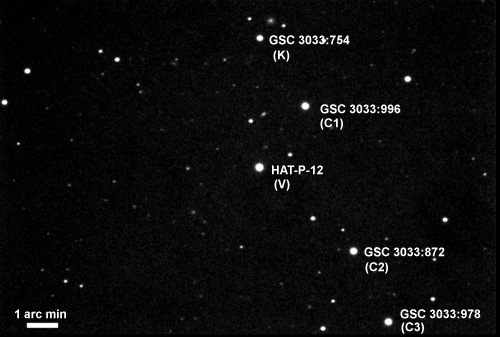
UT (JD 2458541.49 - 2458541.66) Images taken through an Astrodon Exoplanet Blue Blocking (BB) Filter, and reduced using the appropriate Master Dark and Master Flat Frames [ Master.-20c_3x3_030s.S660.AvMedian17.ST10.DARK.FIT & MasterFlat.3x3.Xo.S629.SkyFlats.AvMedian15.FIT] Photometry using 3 calibration stars (C1 to C3) based on AAVSO's Photometry Sequence for HAT-P-12 (see details below) Differential Magnitudes for HAT-P-20 are zero based using average calculated magnitude from the interval (02:30-03:53) that followed the transit Differential Magnitudes for Check Star are zero based using average calculated magnitude from the entire run and are shifted by +0.10mag for display 5 min moving average of Differential Mags are displayed for both HAT-P-12 and theCheck Star. No (V+R) magnitude data was available for the BB (Blue -Blocking) filters used and therefore V Magnitude where used instead for the calibration. (This is likely to make the calculated magnitude slightly off the HAT-P-12's true V mag, but differential magnitudes should still be good) SNR, Ambient Temperature and Altitide data is shown in the graph for information. (note that altitude varied from 51 to 76 over the course of the observing run) Raw Magnitudes & SNR measured using AstroMain/VMA and CCDSoft. Calibrated Magnitudes and Differential Magnitudes calculated usin MS Excel (also used for graphing the results) |
|
|
|
Image of HAT-P-12 |
 |
|
Annotated CCD Image (70% size) Taken through Astrodon Exoplanet Blue Blocking (BB) Filter 25 x 30s exposure (average combine), 3x3 binning, BB / Xo Filter 2019-02-26 23:48 UT (#669271-95) 12" LX200R (at f/10.4) + ST-10XME Auto-guided using TS 80mm APO, ZWO ASI178MC & PHD2 |
Back to Top
|
XO-2b Transit, 2009-11-08 Normalised Differential Magnitudes Time Series graphs showing normalised differential magnitudes (exaggerated scales) Blue dots are data values associated with individual frames whilst yellow dots are a moving average Whilst data scatter (+/-0.032m to +/-0.018m) is larger than the expected transit depth (0.015 mag), the overall dip in XO-2 brightness through the transit window is still noticeable. Notes describing the preparation, recording and analysis of the XO-2b Exoplanet Transit |
|
|
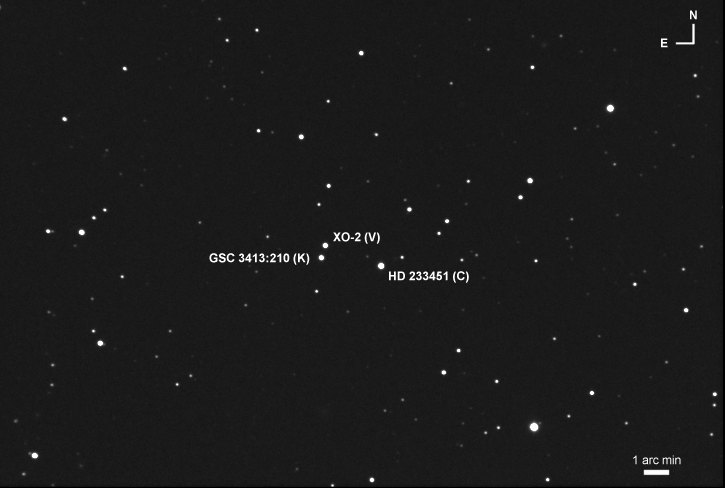
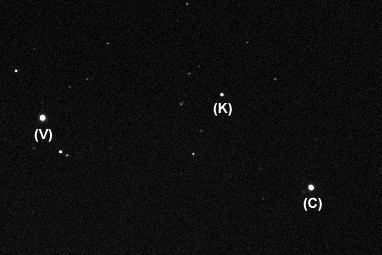
XO-2 / GSC 3413:0005 (Lynx) with comparison/check stars |
|
|
Annotated CCD Image (full frame) 25 x 15 sec exposure (average combine), 3x3 binning, V Filter 2009-11-08 18:53 h UT (#397043-67) 12" LX200R (at f/5.7) + ST-10XME |
Back to Top
Transit Detection Attempt, 2005-08-08
- 4h 20m session attempting to record the transit of extra solar
planet HD 209458b across its sol HD 209458 (Osiris)
- 552 images were recorded over a period of 3h 50m (15 sec exposures
through V filter)
- Inconsistent sky conditions and deteriorating sky conditions with cloud after
01:00 h UT reduced data quality.
A description of the attempt
and results has been compiled.
- Analysis suggests an overall dimming of ~ 0.01 mag during the time of the
transit, but this is unfortunately within the
uncertainty range of the measurement (typically +/- 0.01 to +/- 0.02 mag).
Detection of the dimming event was also compromised by having insufficient data
prior to ingress and deteriorating sky conditions around the time of
egress.
| Dry Run
Analysis 2004-08-20 |
Transit
Analysis 2005-08-08 |
| Graph showing differential magnitudes
for HD 209458 (Corrected for B-V colour difference between HD 209458 and Comparison Star) |
|
| Graphs shows points representing the
average differential magnitude in each 5 min period. High/Low lines are plotted at +/- 1 S.D. Data may possibly shows an overall dimming of ~ 0.01 mag during the time of the transit, but this is unfortunately within the uncertainty range of the measurement (typically +/- 0.01 to +/- 0.02 mag). Detection of dimming is also compromised by having insufficient data prior to ingress and deteriorating sky conditions with cloud around the time of egress. |
| Example V Filter image of HD 209458 HD 209458 (V), HD 209346 (C), GSC 1688:1766 (K) |
|
|
Annotated CCD Image 15 sec exposure (V filter) 2005-08-05 22:30h UT(#91090) |
Back to Top
| This Web Page: | Extrasolar Planet Transits (Projects) |
| Last Updated : | 2019-08-16 |
| Site Owner : | David Richards |
| Home Page : | David's Astronomy Web Site |