David's Astronomy Pages
CCD Images - Session 586 (2015-05-02)
Images
(S585)
Images
Sessions
Home
Page
Images
(S587)
David's Astronomy Pages
|
Images (S585) |
Images Sessions |
Home Page |
Images (S587) |
Objects Session Notes
NGC 6118 - Spiral Galaxy Vega - A0V Star P Cyg - Star Photometric Monitoring - Variables R CrB, CI Cyg, ER UMa
RZ LMi attempt (failed due to star drift)Astrometric Monitoring - Nearby Stars Barnards Star
- Night session (1.5 hrs duration), aborted when cloud developed
- Session operated under semi-automated control, with remote monitoring from indoors computer. - Ambient Temperature: tube temperature fell to -2.5 degC (minimum) - CCD operation -30 degC (at 63% average cooling). - Planned objectives of the session were to monitor selected variable stars & nearby stars and to take Spectral images. -
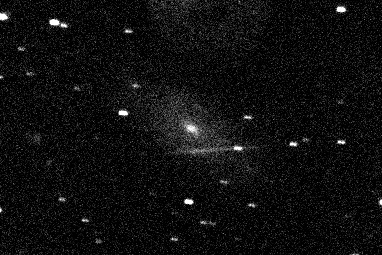
| NGC 6118 / Herschel II-402 (Serpens) |
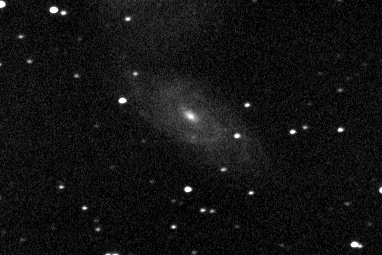 |
| CCD Image (cropped) 5 x 90s exposure (average combine), 3x3 binning, C Filter 2015-05-02 00:48 h UT (#586064-73) 12" LX200R (at f/10.4) + ST-10XME |
| NGC 6118 / Herschel II-402 - Wider View |
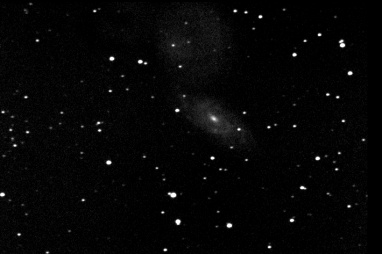 |
| CCD Image (50% size) Image details as above |
Back to Top
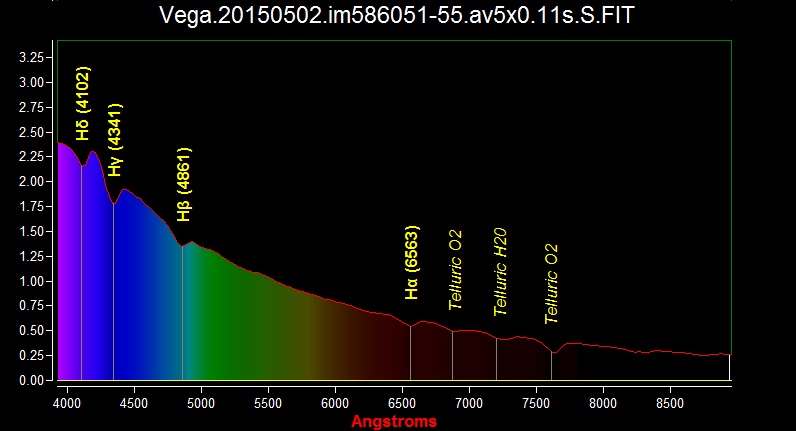
| Vega Spectra Analysis |
| Vega - Seeing |
 |
| CCD Image Animation (frames rotated, but not aligned, cropped) 0.11s exposure, 2x2 binning, Half Frame, SA 200 Filter 2015-05-02 00:27h UT (#586051-55) 12" LX200R (at f/10.4) + ST-10XME (Rotation S586: 184.5 deg) Rotation S286 : 221 deg) |
| Vega - Raw Spectral Profiles Comparison between 5 individual image profiles and stacked image profile (profiles produced in RSpec) |
 |
 |
| Profiles from CCD Images Image details as above |
| 0.11s image (at / near saturation) |
 |
| Stacked CCD Image 5 x 0.11s (aligned, rotated, cropped), 2x2 binning, Half Frame, SA 200 Filter Image details as above |
| 0.2s image (effectively saturated) |
 |
| Stacked CCD Image 5 x 0.2s (aligned, rotated, cropped), 2x2 binning, Half Frame, SA 200 Filter 2015-05-02 00:04h UT (#586017-21) 12" LX200R (at f/10.4) + ST-10XME |
| Vega - Calibrated Spectral Profiles Comparison between profiles from 0.11s and 0.2s image exposures The Red Profile (0.2s) is noticeably flatter in higher intensity regions of the profile due to saturation of CCD Pixels |
 |
|
CCD Image details as above Red Line : Vega.20150502.im586017-21.av5x0.2s.S Blue Line : Vega.20150502.im586051-55.5x0.11s.S (Plot produced in RSpec) |
| |
| Spectral Image / Histogram Plots Comparison between profiles from 0.11s and 0.2s image exposures Plots both displayed with 50000-65535 ADU black-white range |
 |
| Stacked CCD Image (5 x 0.11s) Image details as above |
 |
| Stacked CCD Image (5 x 0.2s) Image details as above |
| Whilst the CCD image values are not reaching near the 65535 ADU
mark, and represent the sum of 4 physical pixels at 1x1 binning, they are photons are 'filling' the pixel bins at a very rapid rate. and are being ? 'absorbed' into the silica of CCD chip somehow rather than being converted into electron count when read. This process whilst worse with 0.2s exposure, is applying also to the shorter exposure 0.11s images (NB. the shortest exposures possible with my ST-10E Camera is 0.11s/0.12s) The following 90s CCD Image of NGC 6118 taken 6 minutes / 4 CCD reads after the last Vega 0.11s spectral image still shows traces of Vega's first and zero order spectra. |
 |
| CCD Image (cropped) 90s exposure (single frame), 3x3 binning, C Filter 2015-05-02 00:32 h UT (#586059) 12" LX200R (at f/10.4) + ST-10XME |
| Calculated Instrument Response (IR = raw vega spectra / smoothed a0V library spectra |
 |
| S586 profile produced using 0.11s exposures of
Vega at Alt 50 deg (airmass 1.30) S585 profile produced using 0.2s exposures of Vega at Alt 68 deg (airmass 1.07) |
| Vega - Corrected Spectral Profile |
 |
 |
 |
| Vega - Normalised Spectra (corrected Vega profile / smoothed library a0V profile |
 |
Back to Top
| P Cyg (Lyra) | ||
| CCD Spectra Image (Star Analyser 200) (Image rotated & cropped) 5 x 5s exposure, 2x2 binning, S Filter 2015-04-21 03:38 h UT (#585280) 12" LX200R (at f/10.4) + ST-10XME Dispersion 25.44 A/px. |
CCD Spectra Image (150%) Image details as left |
|
| P Cyg - Earlier Spectral Image (2008) | Spectral Emission Lines in P Cyg (Cygnus) | |
|
CCD Spectra Image (Star Analyser 100) |
CCD Spectra Image (200%) Image details as left |
|
| P Cyg Spectra Analysis |
| Profile: 0.2s, 2x2 binning, #585280 (calibrated on H alpha
line & dispersion 25.44 A/px) Reference: Example Raw Vega profile supplied with RSpec |
| Analysis made using RSpec |
Back to Top
Back to Top
| This Web Page: | CCD Images - Session 586 (2015-05-02) |
| Last Updated : | 2015-05-15 |
| Site Owner : | David Richards |
| Home Page : | David's Astronomy Web Site |