David's Astronomy Pages
Notes - CCD Session 19 (2002-03-07)
Notes
(S17)
Notes
(Main)
Home
Page
Notes
(S22)
David's Astronomy Pages
|
Notes (S17) |
Notes (Main) |
Home Page |
Notes (S22) |
Notes - CCD Session 19 (S00019) 
Flat Fielding Mosaic Construction Aligning Planet Images FWHM Analysis > Images from CCD Session 19
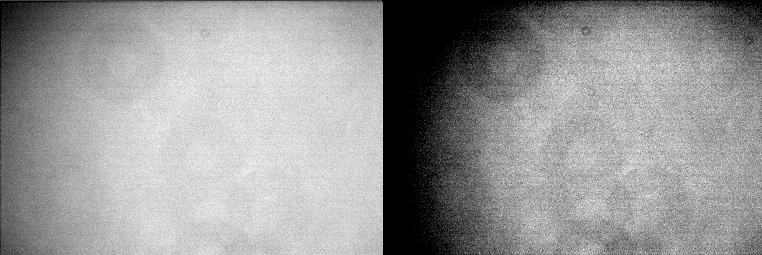
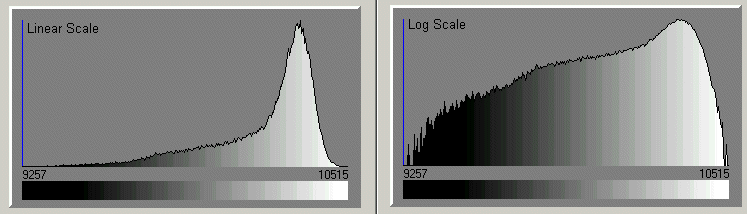
ST7 Following Image and histograms show master flat used for reducing 2x2 binned images, taken on 2002-02-16. Created from 3 x 60 sec flats (averaged) and 5 x 60 sec dark frames (median combined). The flats were of a white board illuminated by a street light.
|
|
Back to Top
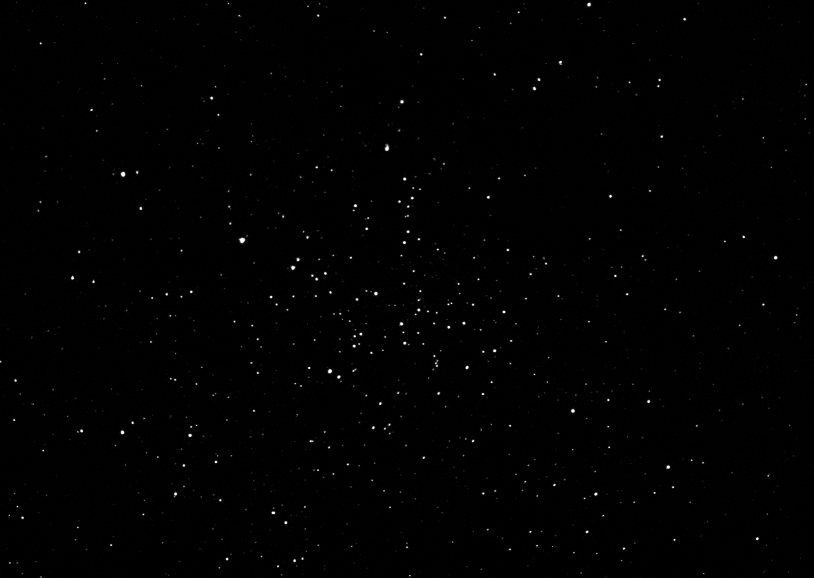
Mosaic Construction M36
Using TheSky program an area covering M36 was selected and divided
into 3 x 3 regions using the Mosaic tool with an overlap of 15% and a field of
view indicator of ST7 at f/10.4.
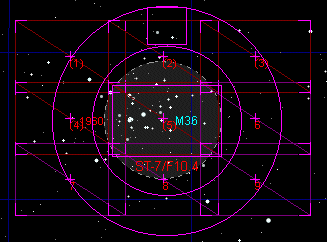
The telescope was moved successively to the centre of each region (a relatively straightforward task using TheSky with telescope control) and a 15 sec exposure taken. The 9 images were then dark and flat field reduced.
The folder of images were 'analysed' using CCDsoft using the Pre-Analyze - Insert WCS/Autoastrometry tool. Each vertical and horizontal pair of images was then opened and a star that was common to both images identified and the centroid position of the star in each image recorded. (Note the 15% overlap makes the task of identifying a common star much easier than the default overlap of 5%, but at the expense of reducing the mosaic area.
A spreadsheet method of calculating the 'mosaic coordinates' of each of the images was then developed:
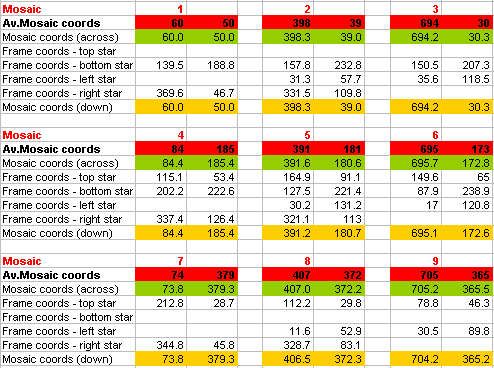
The spreadsheet calculates the relative coordinates of the top left hand coordinates of each region (red cells), this being the average of the coordinates estimates in green cells and orange cells, these being the coordinates calculated based on moving across rows and down columns respectively. The spreadsheet treats Mosaic Region1 as the starting region and then moves outwards and downwards towards the bottom right region (Region 9 in this example).
Moving across Mosaic regions, eg Mosaic 2 from Mosaic 1, the X coordinates of region 2 (X2) are calculated as follows :
X2 = X1 + Star_x1 - Star_x2
= 60 + 369.6 - 31.3
= 398.3
Where X1 and X2 are the Mosaic X Coordinate of the top left hand corner of Region 1 and 2 respectively and Star_x1 and Star_x2 are the Image Coordinates of a common star in Regions 1 and 2 respectively.
Similarly the Y coordinates of region 2 (Y2) are calculated as follows
Y2 = Y1 + Star_y1 - Star_y2
= 50 +46.7 - 57.7
= 39.0
Moving down Mosaic regions, eg Mosaic 4 from Mosaic 1, the X and Y coordinates of region 4 (X4, Y4) are calculated as follows :
X4 = X1 + Star_x1 - Star_x4
and
Y4= Y1 + Star_y1 - Star_y4
This is fairly straightforward, in concept. However the spreadsheet needs to track that coordinates of up to 4 stars need to be recorded for each image (Region 5 needs to track the common star associated with regions above, below, left and right )
The final Mosaic image was then built up in PaintShop Pro.
First a blank greyscale (8 bit) image was created of sufficient size to include
the entire Mosaic area. Region 1 image was then placed on the image (using Paste
As New Selection option) near to, but not directly at, the top left corner of
the mosaic image. The coordinates of the pasted image are then inserted to the
X/Y coordinates of Region 1 in the spreadsheet, and the required mosaic
coordinates of the remaining regions are then automatically recalculated.
Region 2 image was then placed onto the Mosaic using the recalculated coordinate
information to position the image :
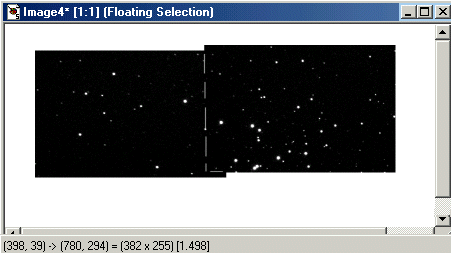
The process was then repeated to bring in images for Regions 3 to 9. The image was then loosely cropped :
|
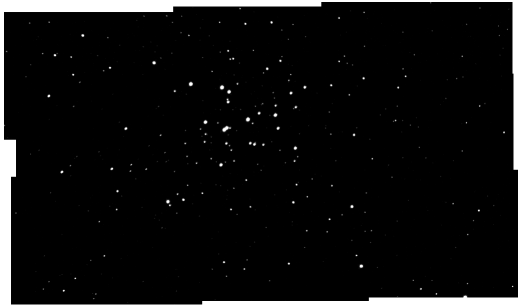
Later on the image was tightly cropped to produce the final image :
Click on above image to see it at full size
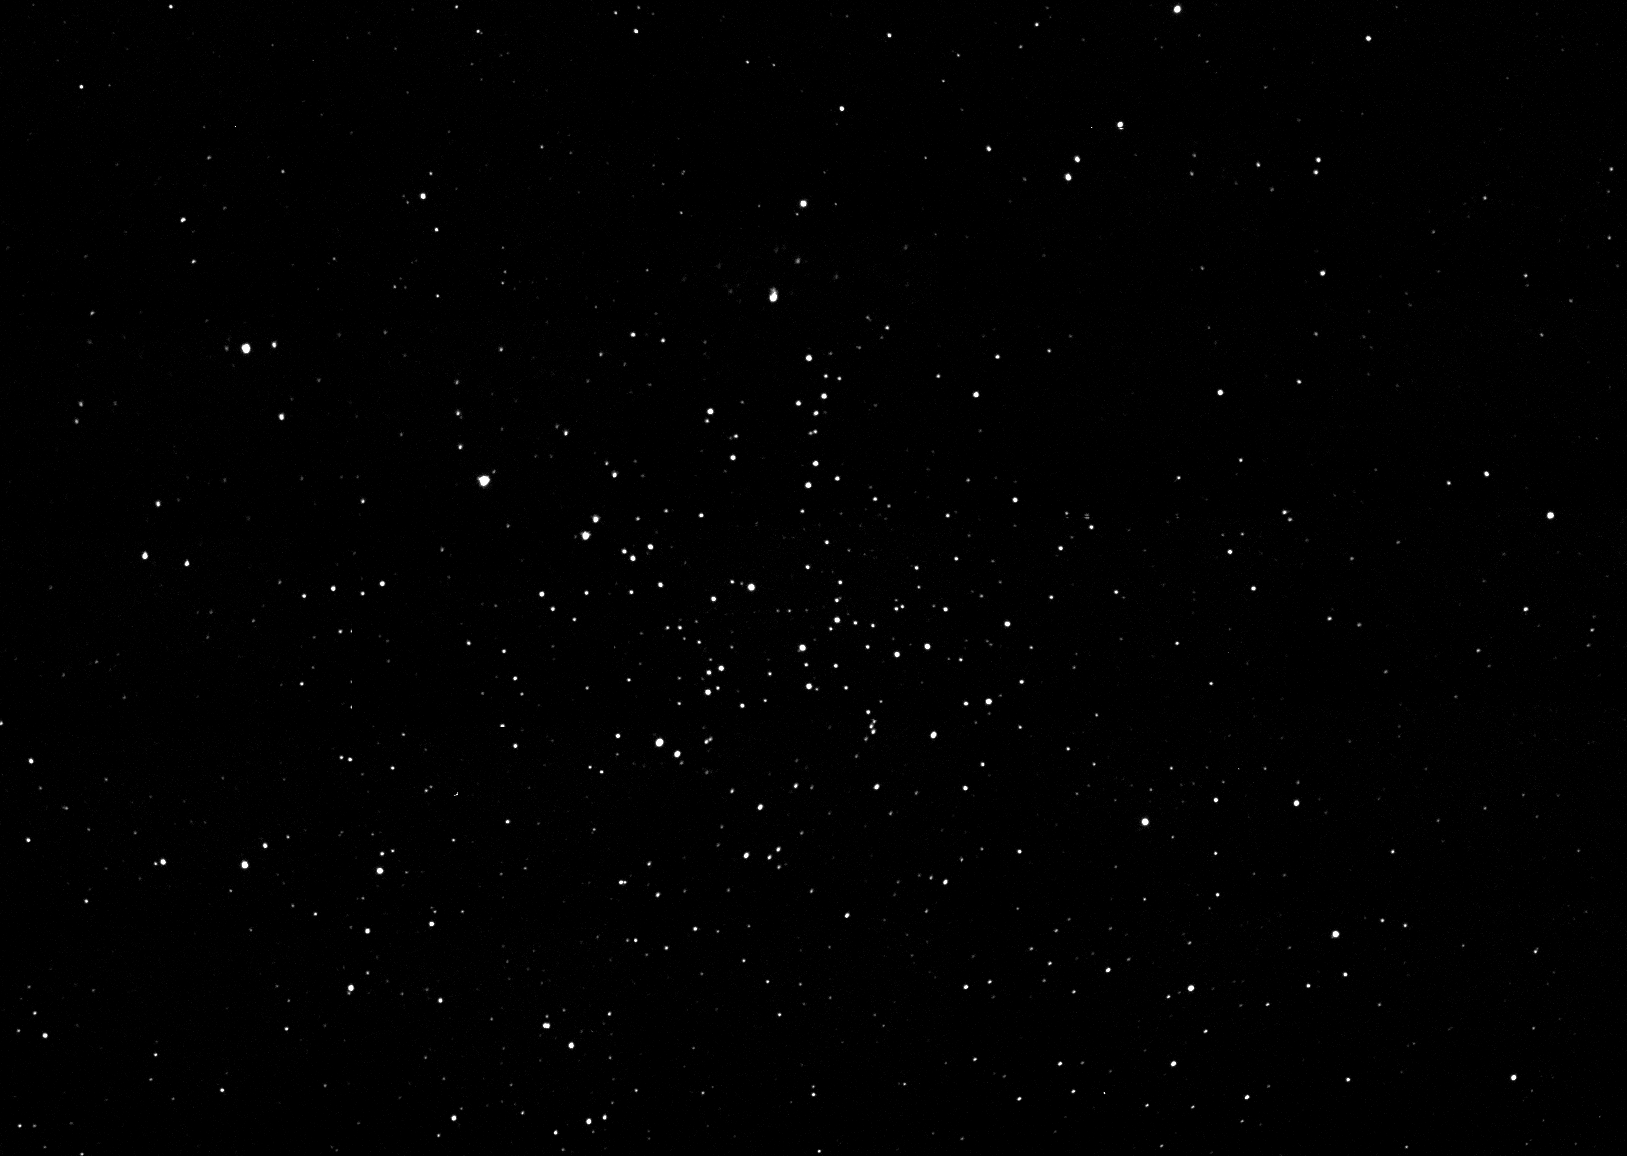
Mosaic Construction M38
Using TheSky program an area covering M38 was selected and divided into 5 x 6 regions using the Mosaic tool with an overlap of 15% and a field of view indicator of ST7 at f/10.4.
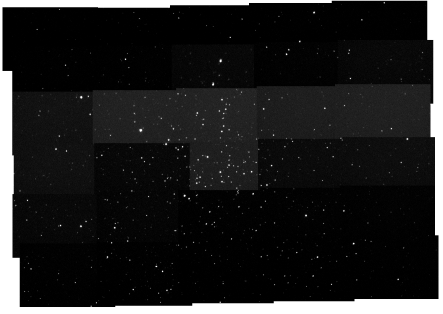
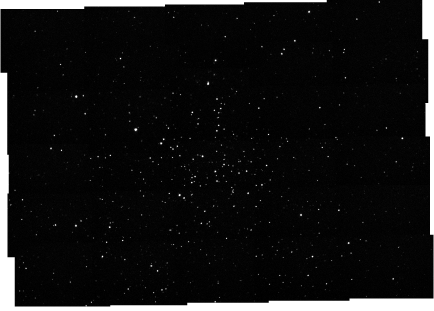
A Mosaic was constructed using the same technique as used for M36. Initial mosaic was disappointing, see below. Although a common background and range was used for all images, light mist passing across the sky during imaging caused caused the sky brightness to vary between images from 76 to 133 ADU. To rectify this and obtain a smooth mosaic the Background on each image was individually adjusted to the peak sky brightness. This was done by adjusted the Histogram using High Contrast button in CCDSoft. The White value was set to Background (Black) + 300 (ie a range of 300 ADU). The original raw Mosaic and subsequent smooth Mosaic are show below:
|
|
| M38, 5 x 6 Mosaic (15 sec exposure). All frames use same background and range. Lighter frames are due to light mist passing across sky and reflecting light |
|
|
| M38, 5 x 6 Mosaic (15 sec exposure). Frames adjusted in line with so that background value matches peak sky brightness (varies from 76 to 133 ADU). Range 300 ADU for each frame |
| See Image at x 0.5 size, full size |
Back to Top
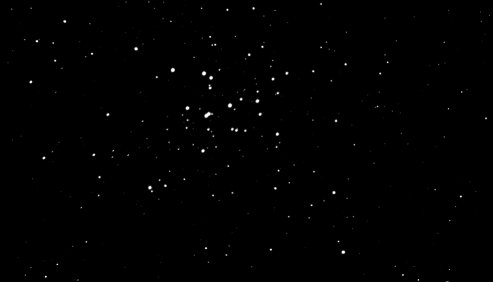
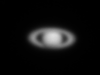
A series of images of Saturn were taken (35 frames at 0.2 sec exposure, over a period of 4 minutes). I wanted to try to stack the best frames, however the precise position of Saturn varies from one frame to the next by a few pixels, due to atmospheric effects and/or poor tracking :
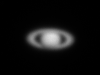
CCDSoft's 'Align folder of images' facility works ok for stars but not for planets. It is possible to 'manually' align images, in CCDSoft by marking a centroid in each of a series of images and then align then, however marking the position of the centre of planet manually is time consuming and somewhat a hit and miss process.
A software routine was therefore written and appended to my Astro Image Workbench Software [details of this software to be added to website in due course ] to align a folder of planet images. The routine estimates the centre of the planet to roughly sub-pixel level and then moves the planet to the centre of the frame. Options have been added to set a global background and range and to crop each image to a specified area. Results shown in following picture :
The method by which the routine determines the centre of the planet is illustrated in the following diagram :
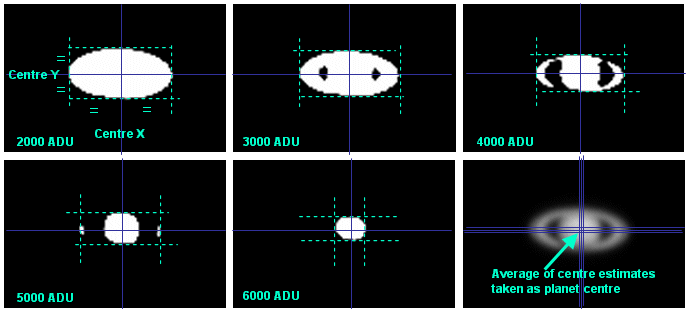
For a series of ADU cutoffs the first and last X and Y pixels having greater or equal to the cutoff value are determined and the centre X and centre Y values calculated. Planet centre is then taken as the average of the various centre estimates. There is a possibility of obtaining an anomolous centre position for some cutoffs, e.g. 5050 ADU might have produced a planet shape where the tip of Saturn's ring showed on one side, but not the other, giving a consequential error in the Centre X estimate. A refinement would perhaps be to take the median of the centre estimates.
Back to Top
Pictures to be added : FWHM on images examined was around 4 arc secs.
Back to Top
| This Web Page: | Notes - CCD Session 19 (2002-03-07) |
| Last Updated : | 2015-05-16 |
| Site Owner : | David Richards |
| Home Page : | David's Astronomy Web Site |