David's Astronomy Pages
CCD Image Notes - Session 89
(2005-06-10)
Notes
(S88)
Notes
(Main)
Home
Page
Notes
(S90)
David's Astronomy Pages
|
Notes (S88) |
Notes (Main) |
Home Page |
Notes (S90) |
Notes from CCD Session 89 (S00089) Image Sharpness (Astronomical Seeing) Fine Focusing - Direct Read-Out of FWHM Sky Brightness (June-January Comparison) Sky Condition Graphs >
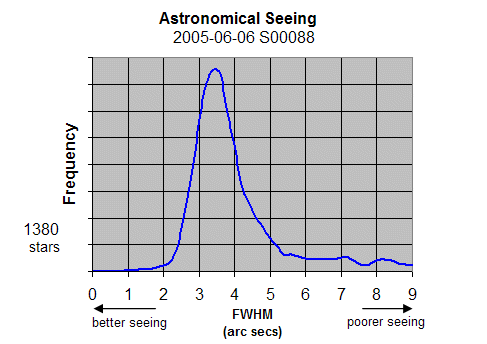
Atmospheric turbulence tends to cause the light from stars to jump around or blur instead of being pinpoint like. Astronomical Seeing is the measure of how sharp stars appear to be, and will vary with altitude, from location to location and from night to night. In CCD Imaging seeing is typically quantified by measuring the Full-Width Half Maximum (FWHM) of the stars in an image. FWHM is the apparent diameter of star at a cutoff value half way between the central peak value and the surrounding background. FWHM is generally calculated by software, though it can be measured 'manually' as an exercise. When used as a measure of seeing it goes without saying that the image shown be at best focus (a poorly focussed image will have have more bloated stars and corresponding FWHM values will be larger and unrepresentative of seeing)
The best sites (mountaintop observatories) are able to produce short exposure images with FWHM of 0.3 arc secs, with more typical values of 0.7 arc secs. Amateurs, living at less desirable sites, are lucky to get FWHM of 2 arc secs, and will often have to deal with values of between 3 and 6 arc secs.
Previous tests have shown that at Kingcup observatory (Broadstone, Dorset) I normally saw FWHM values of around 4 to 5 arc secs. At Clair observatory in NE Scotland, I typically see FWHM values of only 5 to 6 arc secs.
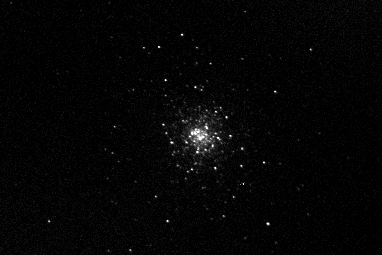
During observing sessions on 2005-06-06 and 2005-06-10 astronomical seeing was noticeably much better than usual , with FWHM values of 2.5 to 3.0 arc secs achieved in many images (see image below).
| M92 Image, FWHM 2.6 arc secs |
|
| 20 sec exposure, green filter 2x2 binning 2005-06-06 (#88032) |
|
|
|
Back to Top
The CCDSoft focus screen tracks either sharpness or maximum pixel value during focusing, however it does track both at the same time, and the sharpness value can not be used to tell exactly how sharp a star's image is, nor can not be used to compare seeing between one session and another. To fill this gap, I added a feature to my CCD Imaging Tool, that reports the FWHM of the brightest star in an image, along with its maximum pixel value and its S/N.
An example of the live output from the tool during S00089 session is shown below. It was able to tell me that at peak focus stars were being resolved with a FWHM (Full Width Half Maximum) value of 3 arc secs, which is pretty good seeing for my location in Scotland, directly adjacent to the North Sea coast.
Take Focus Image
(3s) ... Max 1,145 FWHM= 7.2,
Mag= 9.54, S/N= 107.3
Take Focus Image (3s) ...
Max 930 FWHM= 10.3, Mag= 9.52,
S/N= 109.5
Take Focus Image (3s) ...
Max 554 FWHM= 13.1, Mag= 9.52,
S/N= 109.2
Take Focus Image (3s) ...
Max 897 FWHM= 10.0, Mag= 9.51,
S/N= 110.2
Take Focus Image (3s) ...
Max 1,011 FWHM= 8.4, Mag= 9.50,
S/N= 110.4
Take Focus Image (3s) ...
Max 1,224 FWHM= 7.2, Mag= 9.53,
S/N= 108.7
Take Focus Image (3s) ...
Max 1,498 FWHM= 6.2, Mag= 9.49,
S/N= 111.3
Take Focus Image (3s) ...
Max 2,116 FWHM= 4.6, Mag= 9.51,
S/N= 110.0
Take Focus Image (3s) ...
Max 2,355 FWHM= 4.0, Mag= 9.49,
S/N= 111.0
Take Focus Image (3s) ...
Max 3,508 FWHM= 3.0, Mag= 9.48,
S/N= 112.2
Take Focus Image (3s) ...
Max 3,241 FWHM= 3.0, Mag= 9.98,
S/N= 84.0
Take Focus Image (3s) ...
Max 3,482 FWHM= 3.1, Mag= 9.50,
S/N= 111.0
Take Focus Image (3s) ...
Max 3,426 FWHM= 2.9, Mag= 9.50,
S/N= 110.7
Take Focus Image (3s) ...
Max 3,446 FWHM= 3.1, Mag= 9.49,
S/N= 111.7
Take Focus Image (3s) ...
Max 3,323 FWHM= 3.1, Mag= 9.46,
S/N= 113.3
Take Focus Image (3s) ...
Max 3,599 FWHM= 3.0, Mag= 9.48,
S/N= 112.3
The data from this focusing run is shown in the graph below. The insert pictures show star images at different focus positions, notice how the stars sharpen to a near point at best focus is reached.
| 3 sec exposures Clear Filter, 2x2 binning |
Back to Top
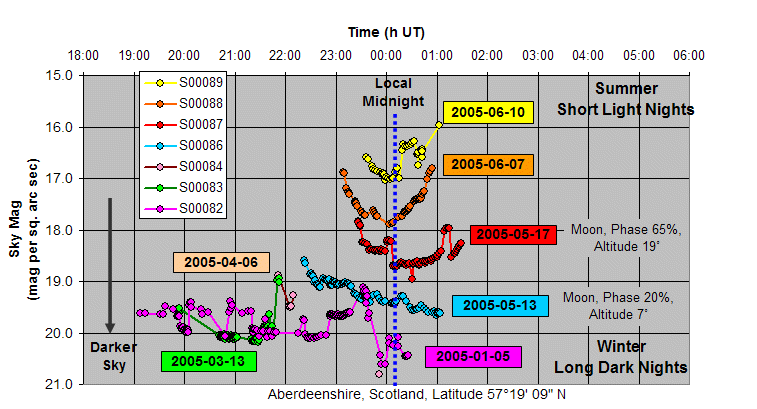
| Sky Brightness Measurements during
observing sessions between Jan 2005 & June 2005 |
||||
|
||||
|
Notes Notice how shortness of June night forces
observation sessions to be taken around local |
||||
|
Date / Session |
Moon | Night Hours (sunset to sunrise) |
Dark Hours (non twilight) |
|
|
2005-06-10, S0089 |
No Moon | 6h 00m | None | |
|
2005-06-07, S0088 |
No Moon | 6h 14m | None | |
|
2005-05-17, S0087 |
Moon at midnight, Phase 65%, Altitude 19˚ | 7h 15m | None | |
|
2005-05-13, S0086 |
Moon at midnight, Phase 20%, Altitude 7˚ | 7h 31m | None | |
|
2005-04-06, S0084 |
No Moon | 10h 21m | 5h 23m | |
|
2005-03-13, S0083 |
No Moon at midnight (Phase 15%, Altitude 5˚ at 21:00) | 12h 19m | 7h 58m | |
|
2005-01-05, S0082 |
No Moon | 17h 05m | 12h 13m | |
Back to Top
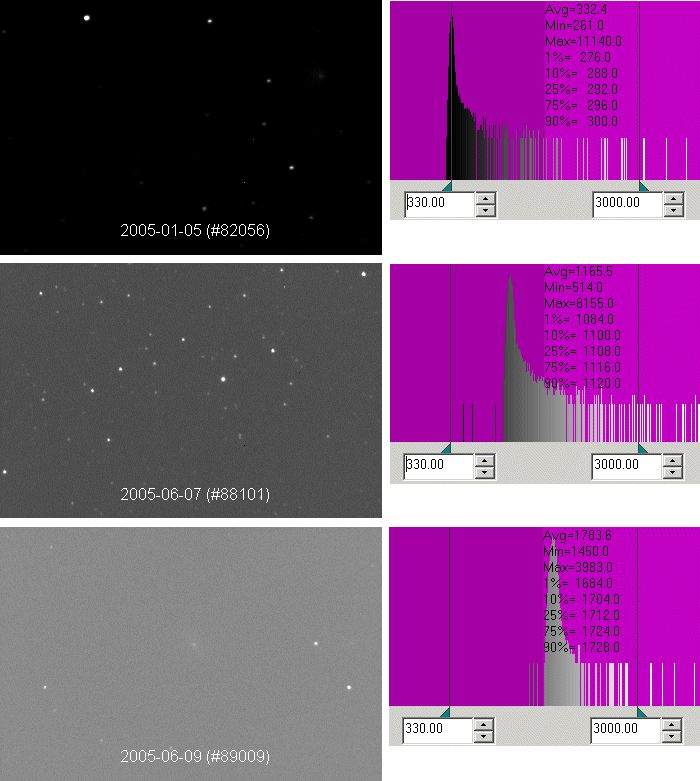
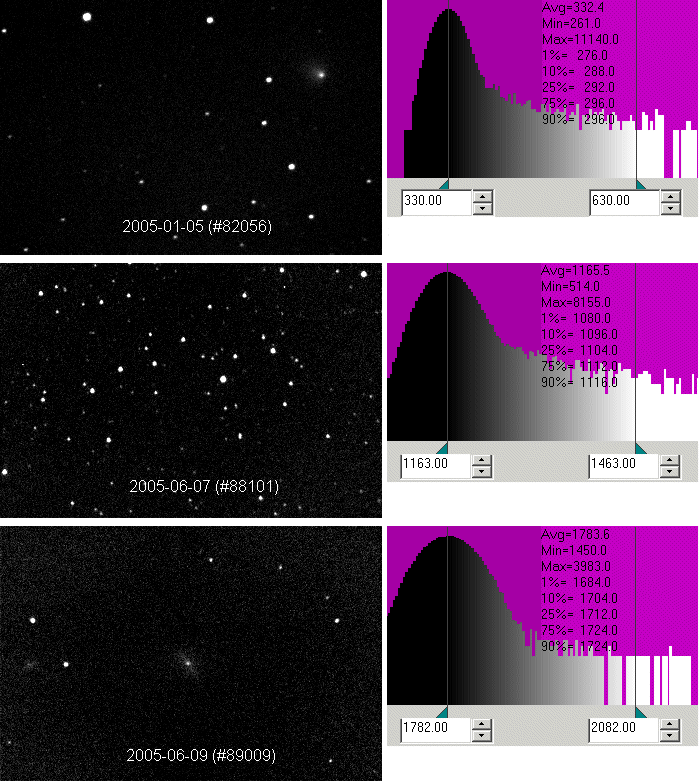
| Comparison of summer & winter CCD exposures showing brighter sky in June exposures a) January exposure (2005-01-05, S0082), Sky Mag +19.9/sq arc sec b) June exposure (2005-06-07, S00088), Sky Mag +17.4/sq arc sec c) June exposure (2005-06-09, S00089), Sky Mag +16.9/sq arc sec all 60 sec exposures, clear filter, identical black/white ranges |
|
| Comparison of summer & winter CCD exposures showing impact of brighter sky on noise levels in June exposure a) January exposure (2005-01-05, S0082), Sky Mag +19.9/sq arc sec b) June exposure (2005-06-07, S00088), Sky Mag +17.4/sq arc sec c) June exposure (2005-06-09, S00089), Sky Mag +16.9/sq arc sec all 60 sec exposures, clear filter, 300 ADU black/white ranges |
|
Back to Top
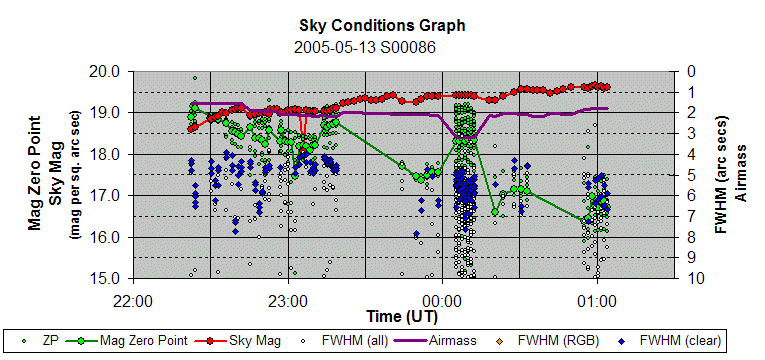
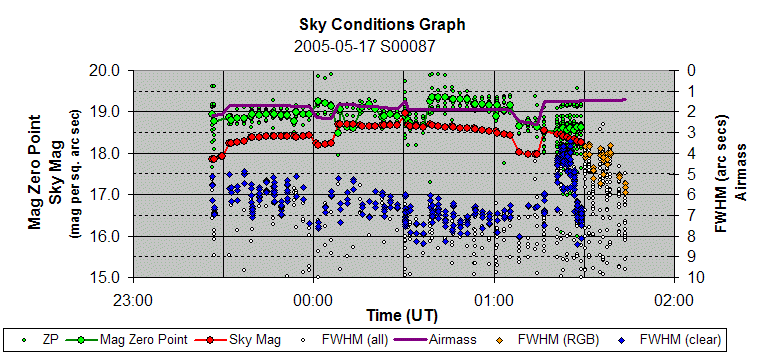
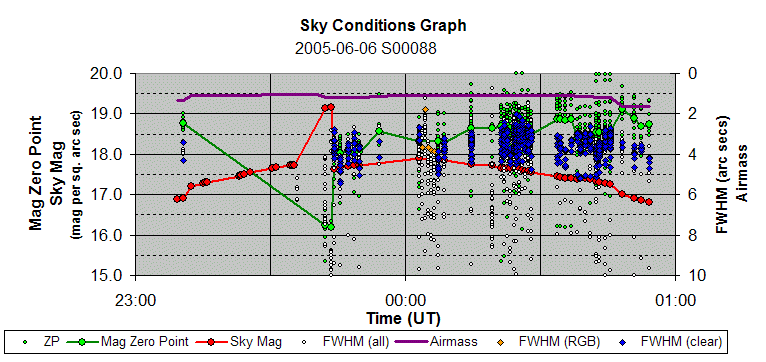
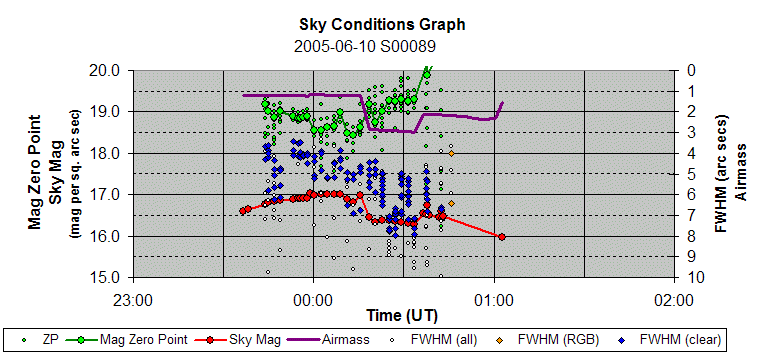
As part of a quantitative analysis of the Sky Brightness and
Seeing Conditions in June observing sessions (2005-06-06 and
2005-06-10), a tools were developed for determining and analysing
observing conditions. These comprised scripts to analyse the the stars and
background levels in recorded images and a spreadsheet for presenting the
results graphically. Graphs showing sky conditions against time for
different observing nights is shown below [ Explanation
of these graphs ] (Note that for each data item the best observing situation is towards
the top of the chart).
| Sky Condition Graphs for Observing Sessions S86 to S89 |
|
|
Notice |
|
|
Notice |
|
|
Notice |
|
|
Notice |
Back to Top
| This Web Page: | CCD Image Notes - (2005-06-10) |
| Last Updated : | 2015-05-16 |
| Site Owner : | David Richards |
| Home Page : | David's Astronomy Web Site |