David's Astronomy Pages
|
Notes (S361) |
Notes (Main) |
Home Page |
Notes (S370) |
|
Linearity tests where carried out on my new CCD camera (ST10-XME) using a moderately bright star. The aim was to determine the point where the KAF 3200ME CCD reached the end of its linear range and thus understand the photometric working range of the camera.
The scope was centered on star SAO 100497 (magnitude: 5.33). A sub-frame was created around the star in CCDSoft and a VB.Net routine was used to take and analyse images at progressively longer exposure times until saturation levels were reached. Datasets were acquired for 1x1, 2x2, 3x3 binning (plus 3x3 off-chip binning) Seeing conditions were less than ideal, with FWHM values generally around 4 to 6 arc secs (typical of my near sea level site). Datasets contain FWHM excursions up to 8-11 arc secs due to wind vibration or seeing turbulence, however the instrumental magnitudes do not appear to be too much affected.
|
|
|
|
Instrumental magnitudes were calculated using CCDSoft's photometric calculation with aperture diameters of 24 pixels (1x1), 12 pixels (2x2) and 8 pixels (3x3), equivalent to 19.4 arc secs (~ 3.5 x FWHM).
|
|
Star Counts were back calculated from
Instrumental magnitudes using the equation : Star Count
= 10^(Inst.Mag/-2.5)
Resulting plots showing Total Star Count (ADU) and against
exposure time are shown below. Model lines showing linear fit to
short exposure times reveal the departure from linearity in longer
exposures. The plot also shows the Maximum Pixel Value (ADU) associated
with each star image. The graphs show that 1x1, 2x2 and 3x3 datasets
all seem to show a saturation level at ~55,500 ADU. This is a
fraction below 58,300 ADU, which would corresponds to a electron saturation
level of 77,000 e- (at gain of 1.32 e-/ADU). The saturation level appears to be
the same regardless of degree of on-chip binning. For off-chip
binning maximum pixel value is set by the16 bit limit, i.e. 65535.
|
|
|
|
|
|
The graphs below show plots of Instrumental Magnitude vs Exposure Time for each binning level. Subtracting Model Magnitude (derived from Linear Model fitted to star count from shortest exposures), reveals the estimated magnitude error associated with images that taken into the non-linear range.
|
|
|
|
|
|
|
Converting measurements of Star Count into a Flux (Star Count/sec)
|
Back to Top
TPoint Mapping run was attempted at the end of session S365, but wasn't completed before dawn arrived. Unfortunately only one half of the sky was mapped, and therefore the run will needed to be repeated.
The run showed that my automated mapping routine was working ok with new telescope/camera and indicated that polar alignment was pretty reasonable (with alignment error < 4 arc minutes)
|
TPoint Plots (76 points, 11 terms) |
||||||||||||||||||||||||||||||||||||||||||||||||||||||||||||
|
|
||||||||||||||||||||||||||||||||||||||||||||||||||||||||||||
|
|
||||||||||||||||||||||||||||||||||||||||||||||||||||||||||||
| Model Fits | ||||||||||||||||||||||||||||||||||||||||||||||||||||||||||||
|
6 terms: 211 arc secs |
||||||||||||||||||||||||||||||||||||||||||||||||||||||||||||
|
||||||||||||||||||||||||||||||||||||||||||||||||||||||||||||
|
Polar Alignment Information |
||||||||||||||||||||||||||||||||||||||||||||||||||||||||||||
|
6 terms: 11 terms |
Back to Top
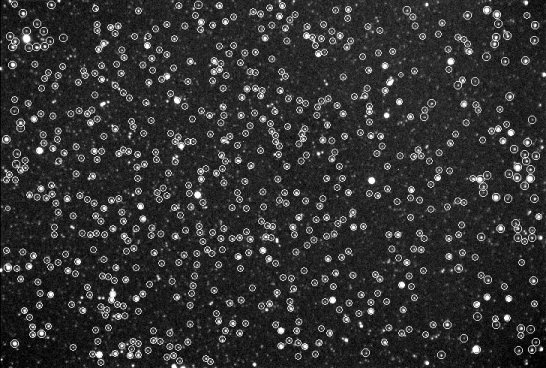
Following the session collimation measurements
were made on the set of T-Point automapping images using CCD Inspector 2.1.6.
The most suitable image (a well focused image with 420 well spaced stars) showed
a collimation error of 20" with image curvature of 16.3%.
Nine other images each with over 200 stars showed an average collimation error
of 23" (range 17-27") with image curvature of 16.2%.
The results confirm those made during session S361 and show that the collimation changes made during session S360, were not as successful as had been initially thought, and probably indicate the reason why FWHM measurements of no better than 4.0 arc secs have been achieved during the last few sessions.
|
Collimation Checks (S365) |
|
|
|
Image with numerous well spaced
stars |
|
|
CCD Image with Stars used by CCD
Inspector |
|
|
|
Curvature Measurement for 12" LX200R
with f6.3 focal reducer - 2009-05-01 |
|
|
|
CCD Inspector plot Image details as above (#365138) |
|
|
|
Collimation Measurement -
2009-05-01 |
|
|
|
CCD Inspector plot Image details as above (#365138) |
|
|
|
Collimation Check - 2009-04-05 |
|
|
|
CCD Inspector plot 20s sec exposure, 2x2 binning, C Filter (#361021) 12" LX200R (at f/5.7) + ST-10XME |
|
|
|
Collimation Measurement -
2009-04-01
(post Re-Collimation) |
|
|
|
CCD Inspector plot 15s sec exposure, 2x2 binning, C Filter (#360292) 12" LX200R (at f/5.7) + ST-10XME |
|
|
|
|
Table of Collimation / Curvature Measurements - 12" LX200R (at f/5.7) + ST-10XME
Session Images Stars
Aspect
Ratio
Curvature
Collimation
(arc secs)Average FWHM
(arc secs)Tilt X Tilt Y Total Tilt S356 (First Light Session) 30 x 30s 148 +/- 13 38 % +/- 20% 16 % +/- 1% 41.6" +/- 6.3" 5.4" +/- 0.7" -0.9" +/- 0.1" -0.3" +/- 0.1" 16% @ -157 deg S356 (First Light Session) 6 x 60s 410 +/- 22 38 % +/- 10% 27 % +/- 1% 35.0" +/- 6.5" 5.3" +/- 0.3" -1.1" +/- 0.2" +0.5" +/- 0.1" 20% @ -149 deg S357 Collimation attempt S358 7 x 90s 575 +/- 40 19% +/- 8% 24 % +/- 2% 36.3" +/- 6.3" 5.5" +/- 0.4" +0.9" +/- 0.2" +0.1" +/- 0.1" 15% @ - 5 deg S358 6 x 45s 633 +/- 73 14% +/- 3% 21 % +/- 2% 31.7" +/- 7.6" 4.9" +/- 0.4" +0.7" +/- 0.2" +0.3" +/- 0.1" 10% @ - 22 deg S358 3 x 60s 695 +/- 80 16% +/- 6% 24 % +/- 1% 36.1 +/- 4.0" 5.9" +/- 0.6" +0.9" +/- 0.1" +0.1" +/- 0.0" 14% @ - 9 deg S360 2 x 20s 199 +/- 1 16% +/- 4% 22 % +/- 3% 13.9 +/- 1.3" 4.0" +/- 0.2" +0.6" +/- 0.1" +0.0" +/- 1.0" 12% @ - 9 deg S360 3 x 20s 184 +/- 27 27% +/- 5% 24 % +/- 6% 14.7 +/- 1.5" 4.2" +/- 0.3" +0.5" +/- 0.1" -0.1" +/- 0.1" 12% @ 19 deg S360 Collimation attempt S360 - Post Collimation 4 x 20s 223 +/- 13 17% +/- 1% 17 % +/- 3% 3.7 +/- 1.0" 4.0" +/- 0.1" +0.2" +/- 0.1" -0.1" +/- 0.1" 4% @ 20 deg S361 2 x 20s 412 +/- 65 14% +/- 1% 22 % +/- 1% 25.1 +/- 5.7" 4.5" +/- 0.1" +0.8" +/- 0.1" -0.4" +/- 0.1" 15% @ -33 deg S365 5s 420 15% 16.3% 19.9" 4.7" +0.5" +0.0" 10% @ +3 deg S365 10 x 5s 277 +/- 68 17% +/- 5% 16 .3% +/- 0.2% 23.1 +/- 3.4" 5.0" +/- 0.7" +0.5" +/- 0.2" +0.1" +/- 0.2" 11% @ -15 deg
Back to Top
| This Web Page: | Notes - Session 365 (2009-04-30) |
| Last Updated : | 2015-05-16 |
| Site Owner : | David Richards |
| Home Page : | David's Astronomy Web Site |