David's Astronomy Pages (All Sky Camera)
Aurora on night 2025-12-12 / 2025-12-13
Aurora
2025-11-11
Aurora
Page
Home
Page
Aurora
2026-03-06
David's Astronomy Pages (All Sky Camera)
|
Aurora 2025-11-11 |
Aurora Page |
Home Page |
Aurora 2026-03-06 |
Aurora Notes
Night Summary (Keogram) Plot AllSky Pictures Videos Magnetometer Plots Magnetometer Stack Plots (for reference) Planetary K-Index Plot (for reference) Aurora Forecast, NOAA/Ovation (for reference)
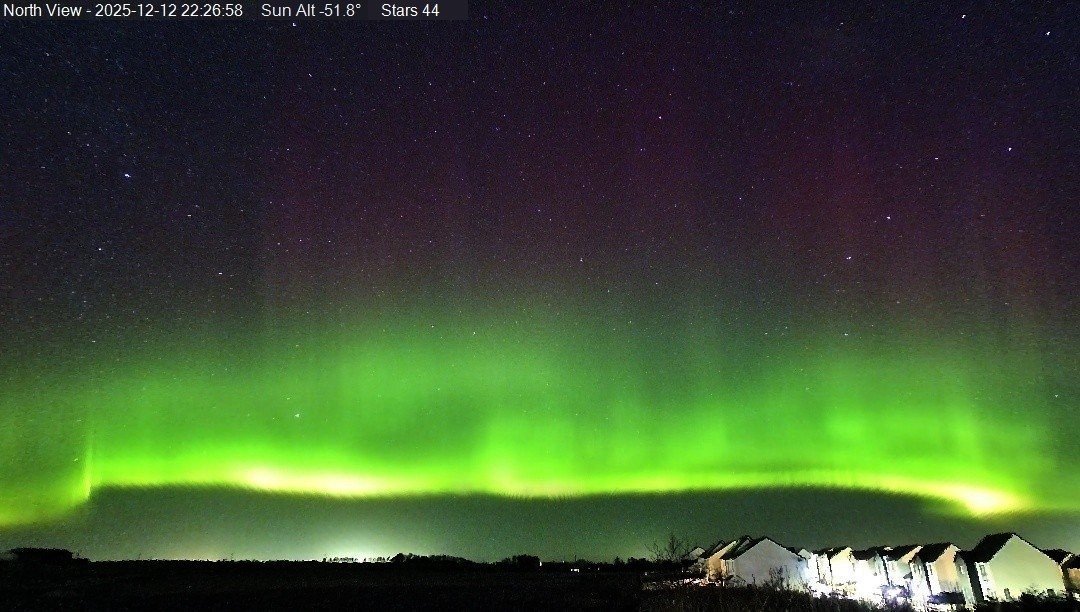
- Auroral activity on the night 2025-12-12 / 2025-12-13 associated with a period of geomagnetic activity up to Kp5
Skies in NE Scotland were generally clear for the whole display
Activity was visible on camera images from around 17:00 to 02:15 UT (GMT) with peaks around 19:30 and around 22:30 UT (GMT).
Observed activity comprised a variety of green aurora stretching to 40° altitude, with occasional faint red rays. Interesting green streamers at 18:34-18:38 & 18:47 UT (GMT).
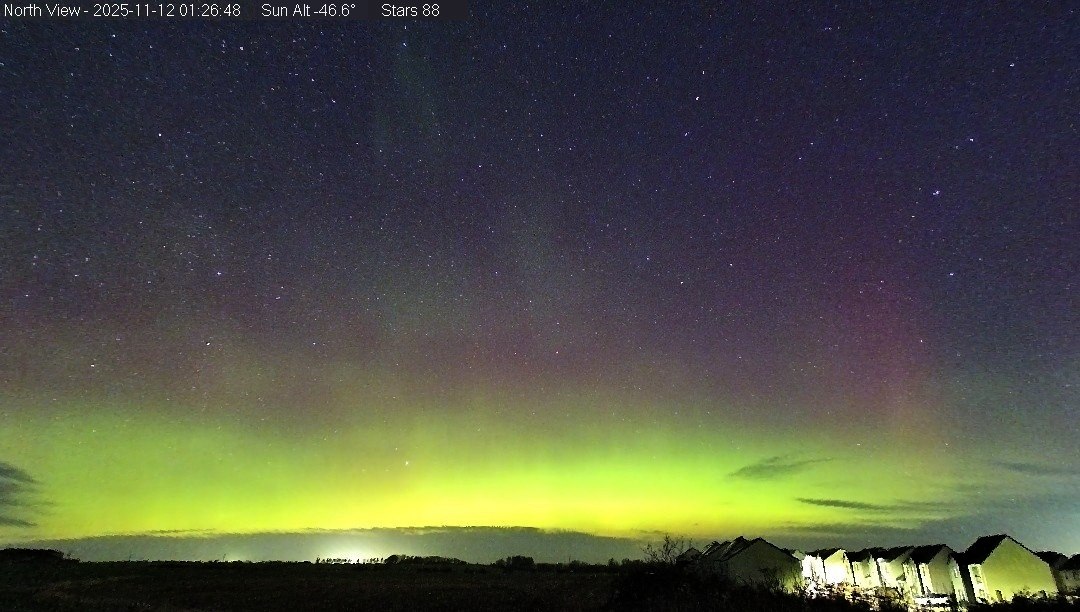
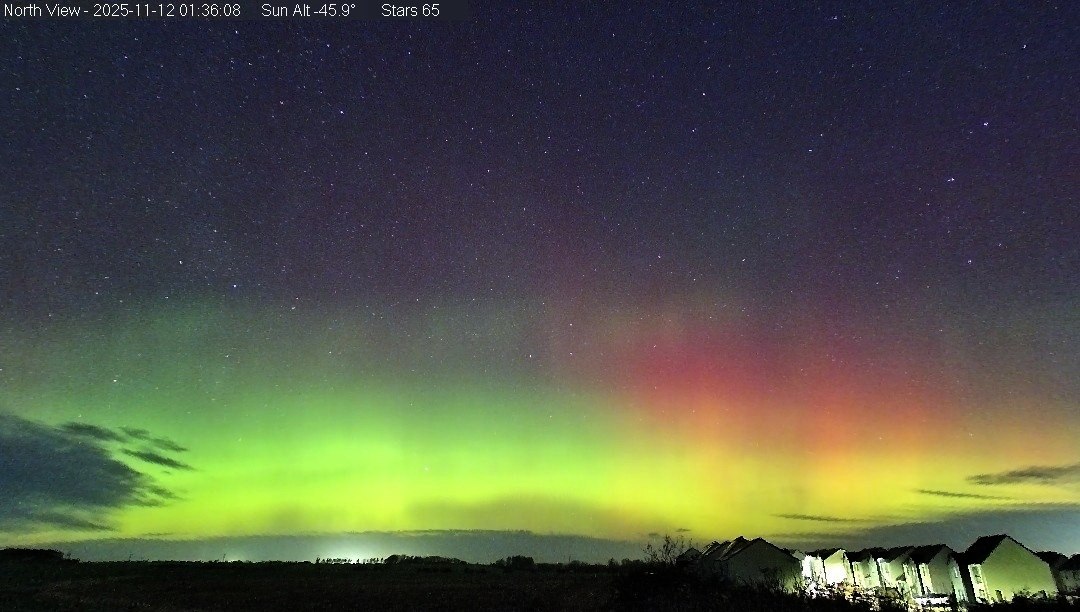
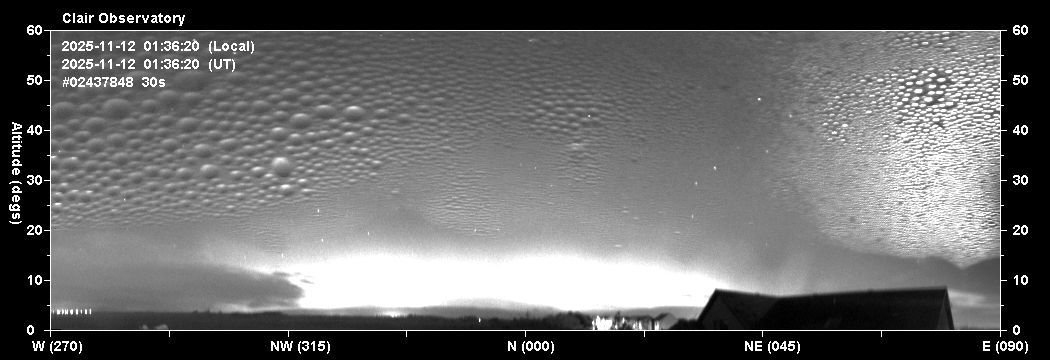
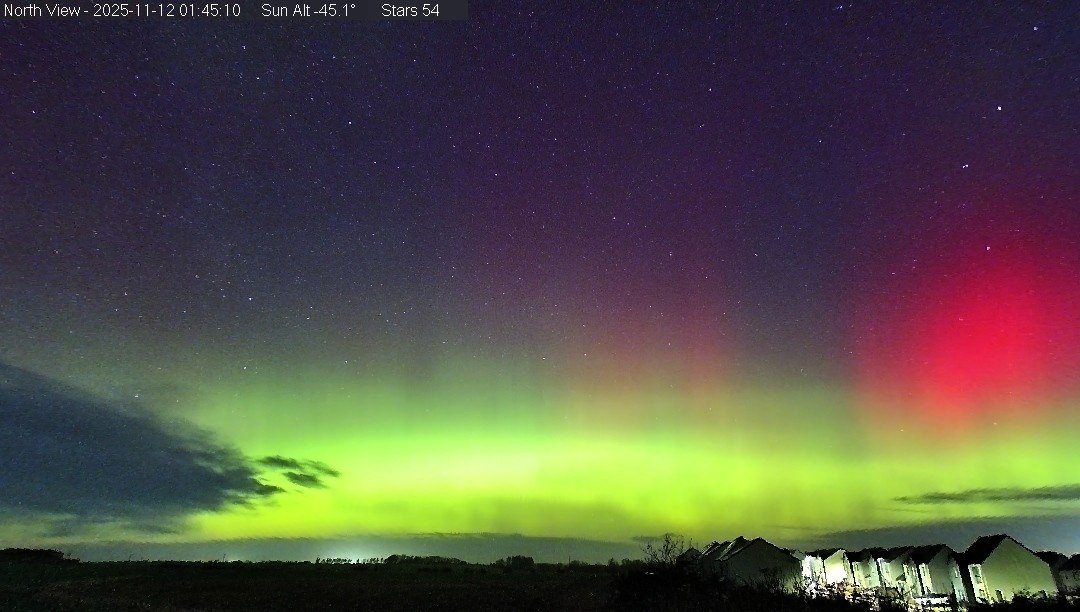
Images and video below compare colour images captured by the north facing Tapo C325WB Camera, with the black/white images captured using the existing AllSky Camera at approximately the same time.
- Scandinavian magnetometers recorded activity from15:00 to 02:30 UT with initial peak of activity at 18:30-20:30 UT, with further peak in activity at 22:15 to 00:30 UT.
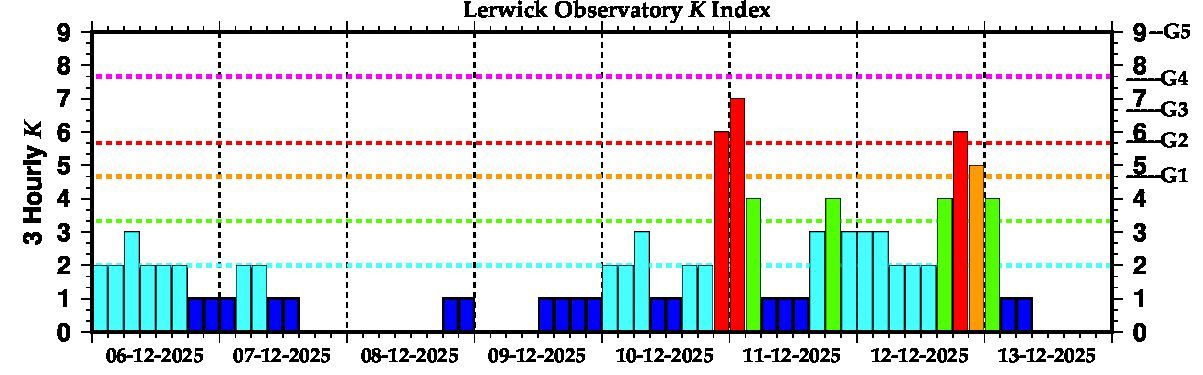
Lerwick Magnetometer shows activity up to K6.- Telescope Images from 2025-12-12 >> - -
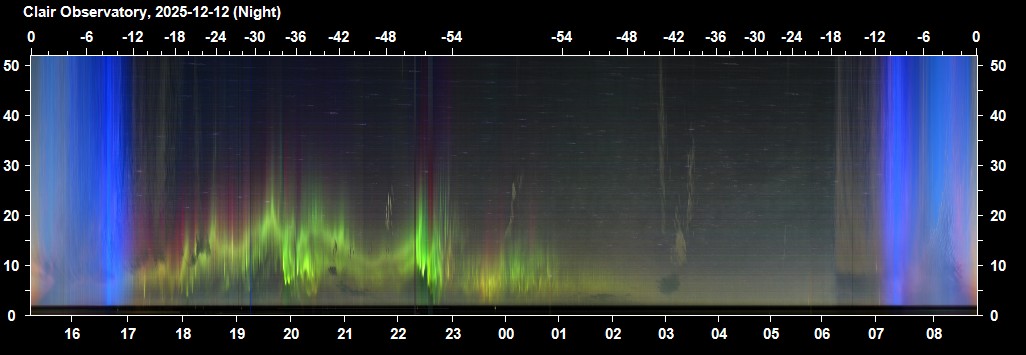
| Night Summary Plot - North Sky (2025-12-12 / 2025-13-13) Aurora Activity visible on colour keogram from 17:00 to 02:15 UT with peaks around 19:30 and to 22:30 UT (GMT) Note: Times on plot are local times (GMT) |
 |
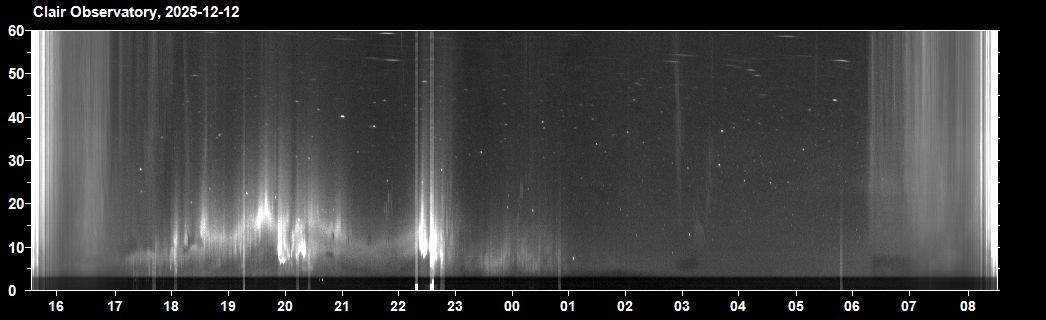
| Night Summary Plot - North Sky (2025-12-12 / 2025-13-13) Note: Times on plot are local times (GMT = UT) Aurora Activity faintly visible on b/w keogram from17:15 to 01:00 UT (GMT) |
 |
| Scandinavia Magnetometers vs NorthCam Keogram - 2025-12-12 / 2025-13-13 |
 |
Back to Top
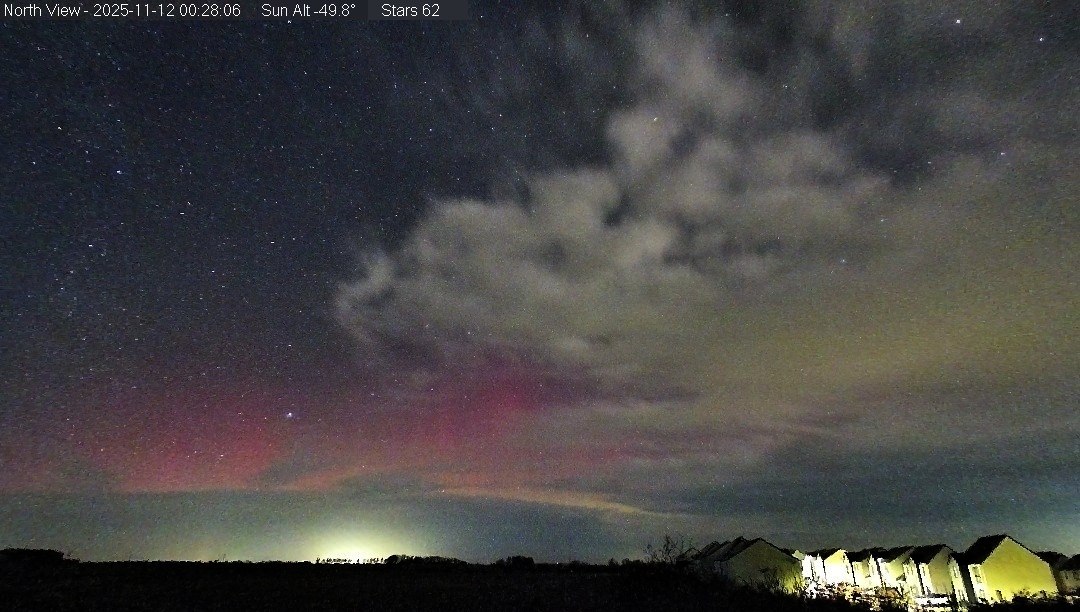
| Panoramic View - Northern Sky |
| 2025-11-12 00:28 UT (GMT) Aurora |
 |
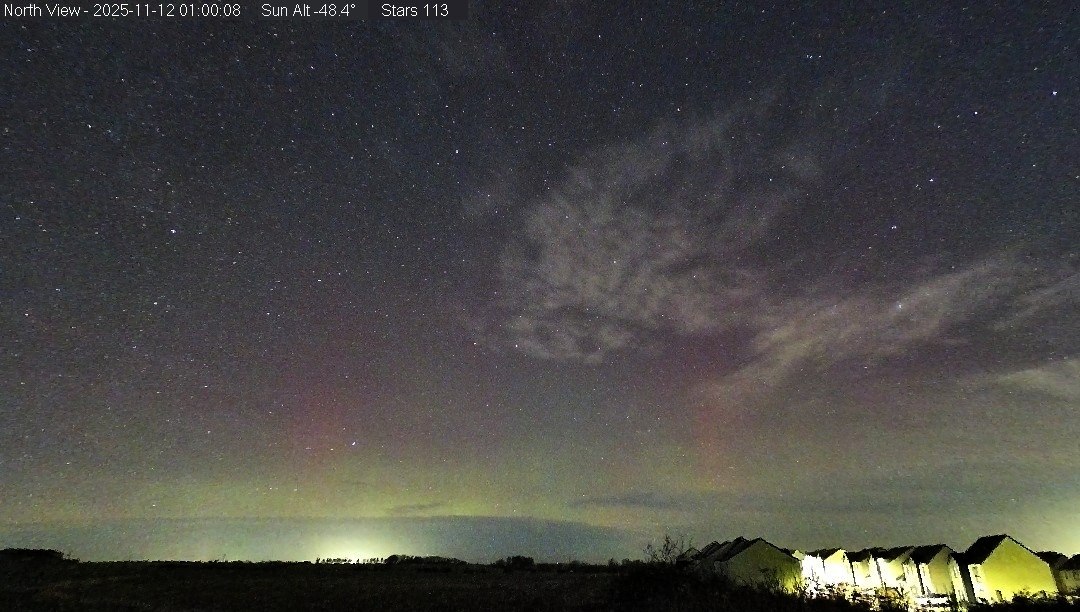
| 2025-11-12 01:00 UT (GMT) Aurora |
 |
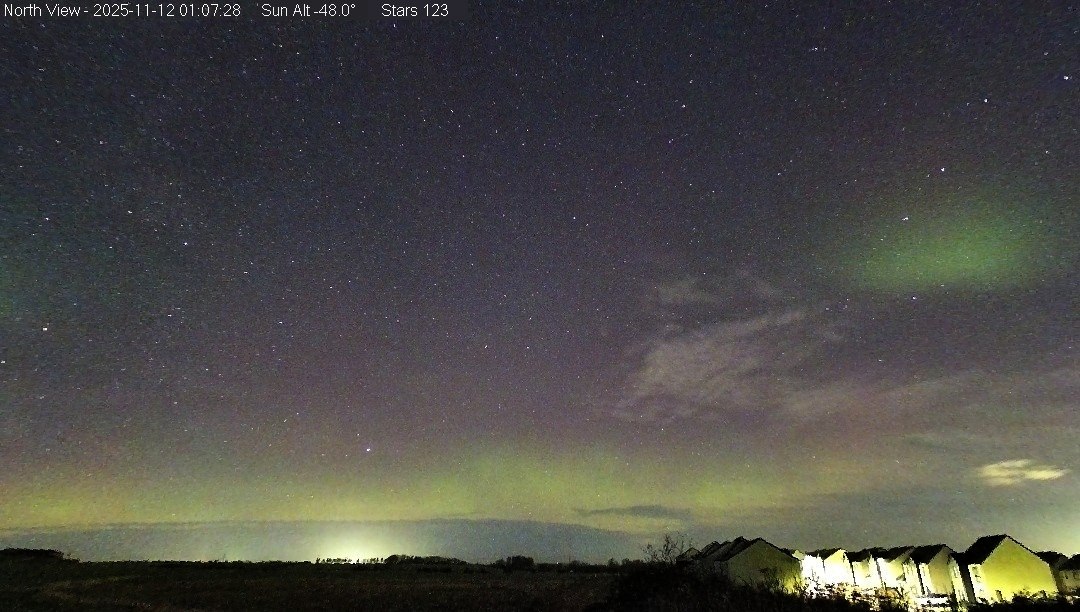
| 2025-11-12 01:07 UT (GMT) Aurora |
 |
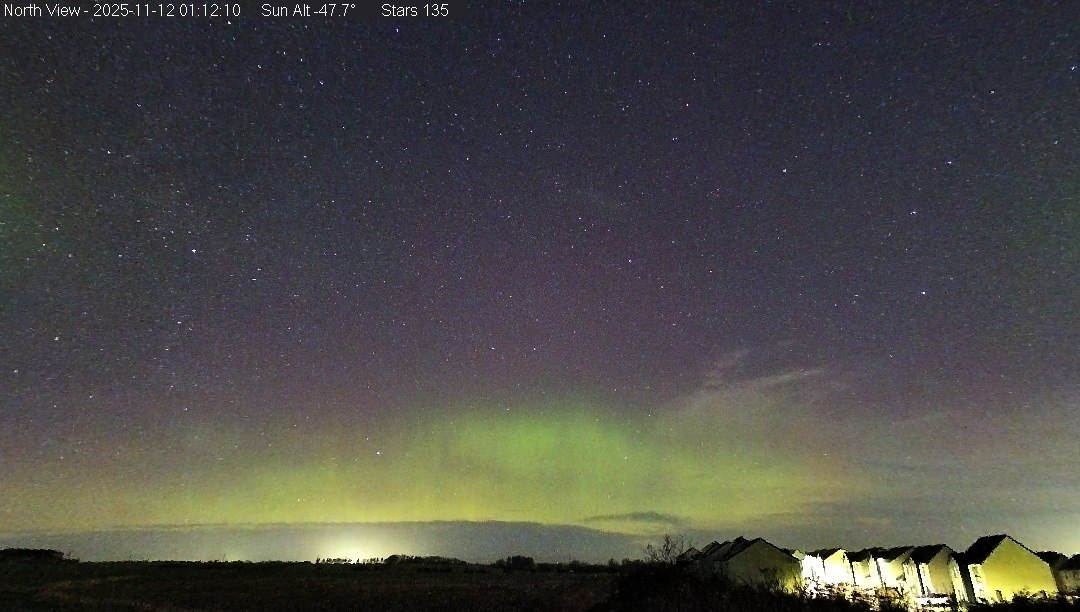
| 2025-11-12 01:12 UT (GMT) Aurora |
 |
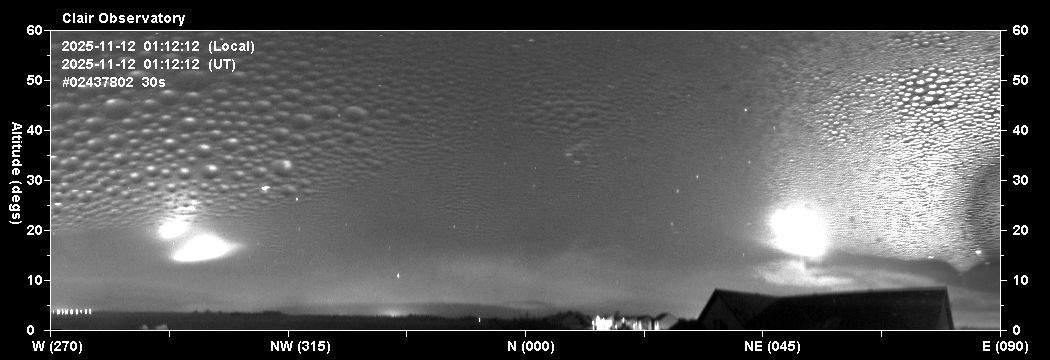 |
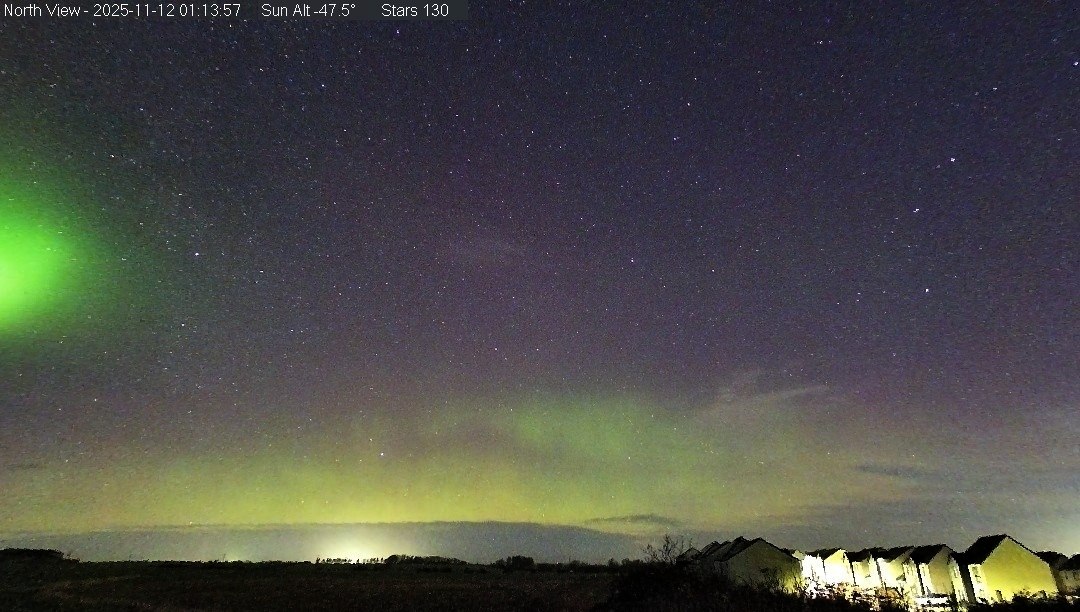
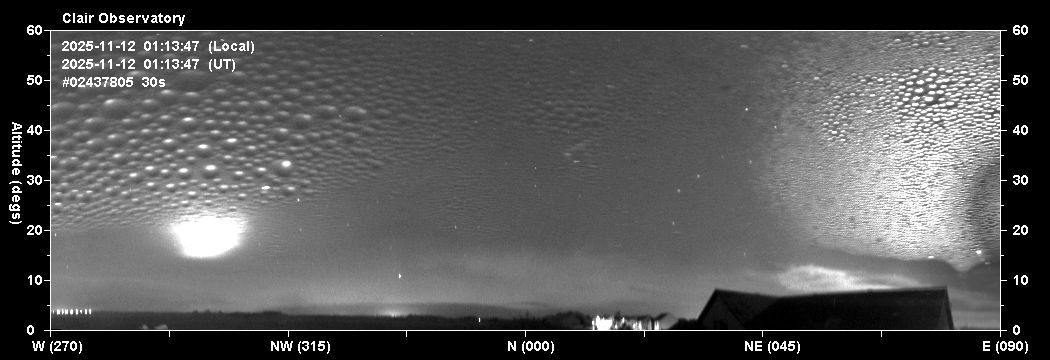
| 2025-11-12 01:13 UT (GMT) Aurora |
 |
 |
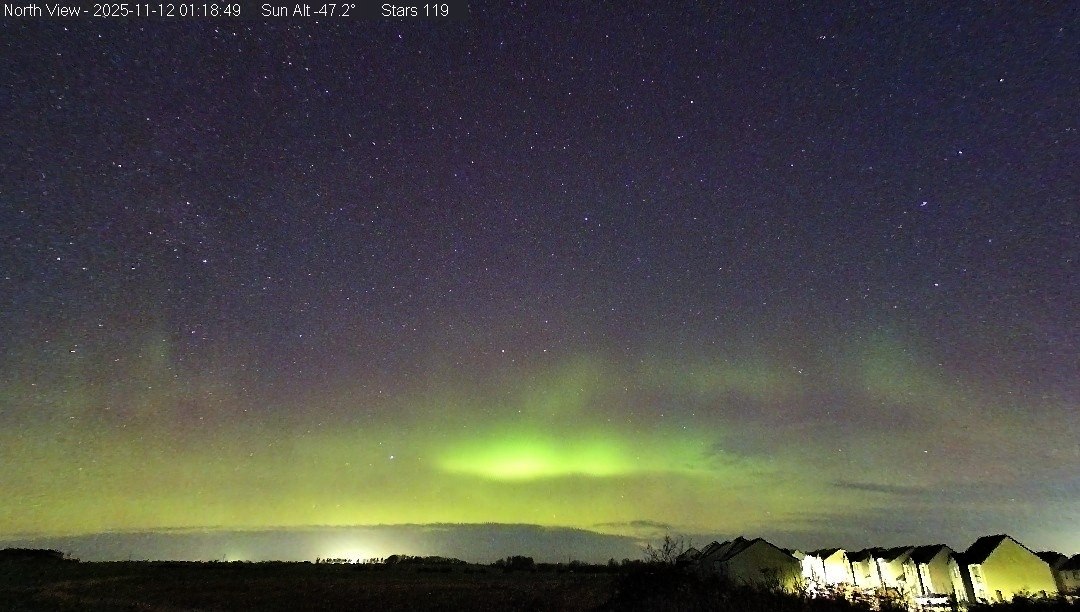
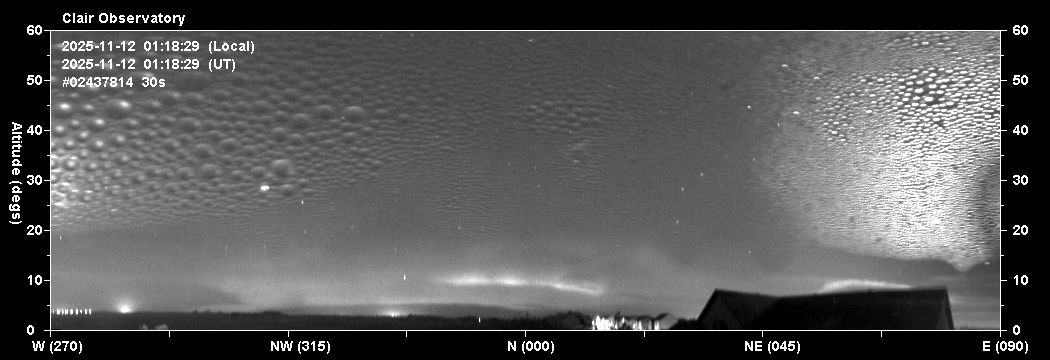
| 2025-11-12 01:18 UT (GMT) Aurora |
 |
 |
| 2025-11-12 01:26 UT (GMT) Aurora |
 |
| 2025-11-12 01:36 UT (GMT) Auroral |
 |
 |
| 2025-11-12 01:45 UT (GMT) Auroral |
 |
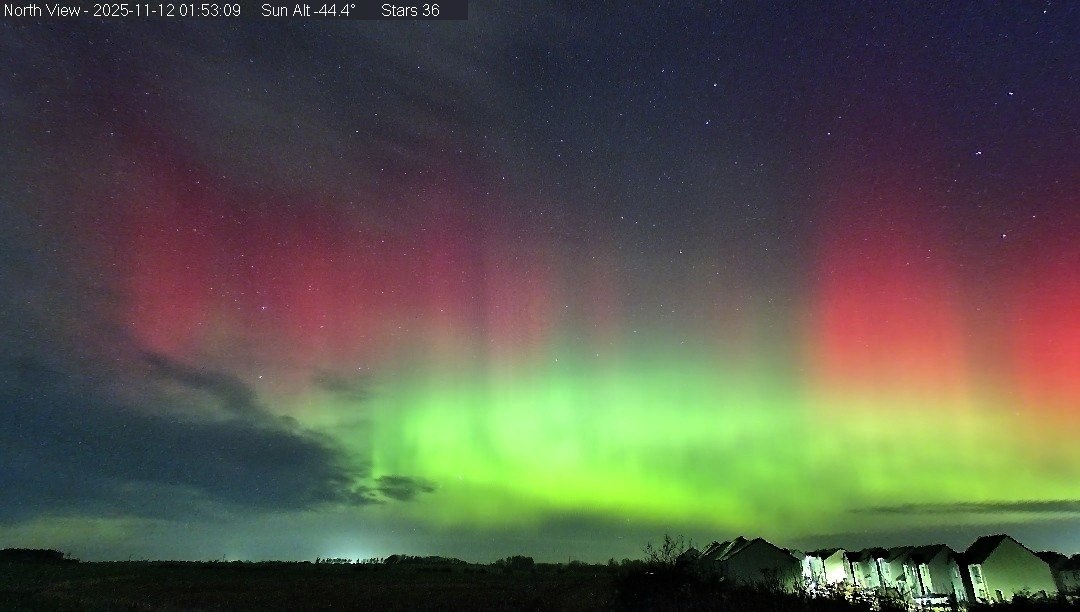
| 2025-11-12 01:53 UT (GMT) Auroral |
 |
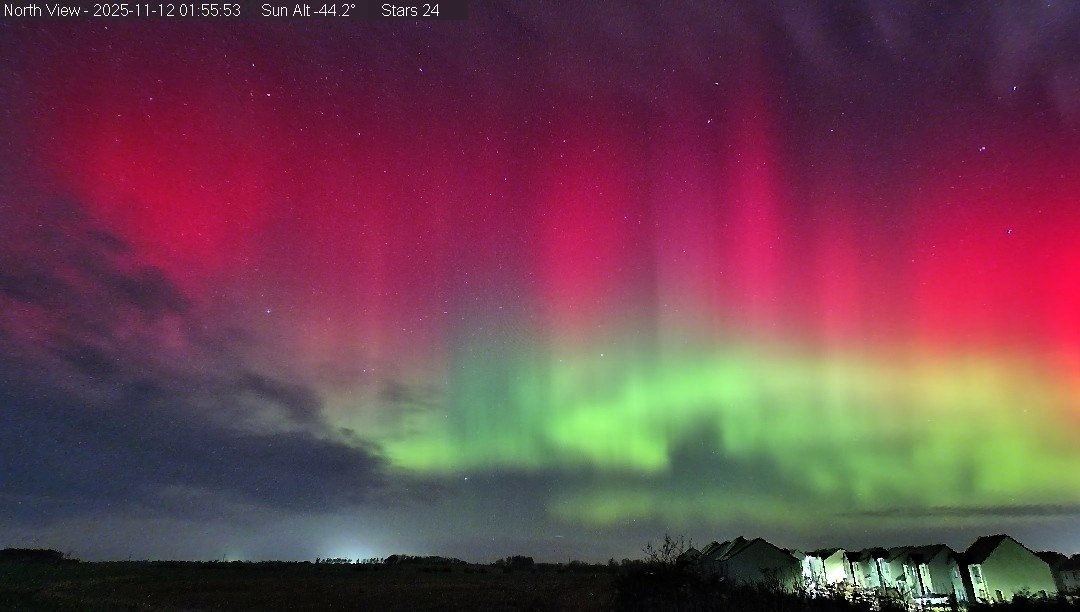
| 2025-11-12 01:55 UT (GMT) Auroral |
 |
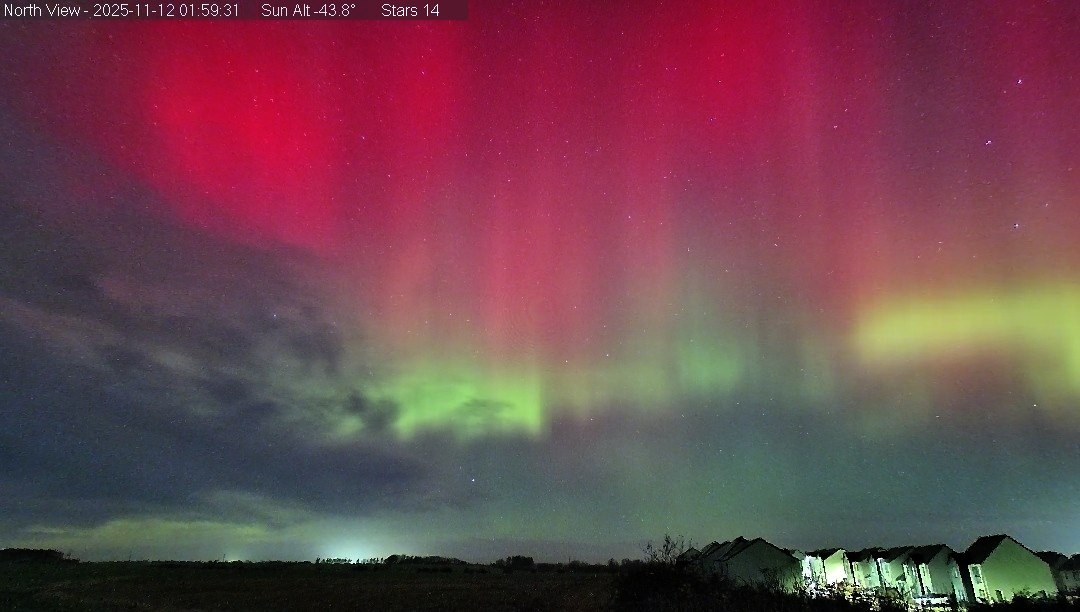
| 2025-11-12 01:59 UT (GMT) Auroral |
 |
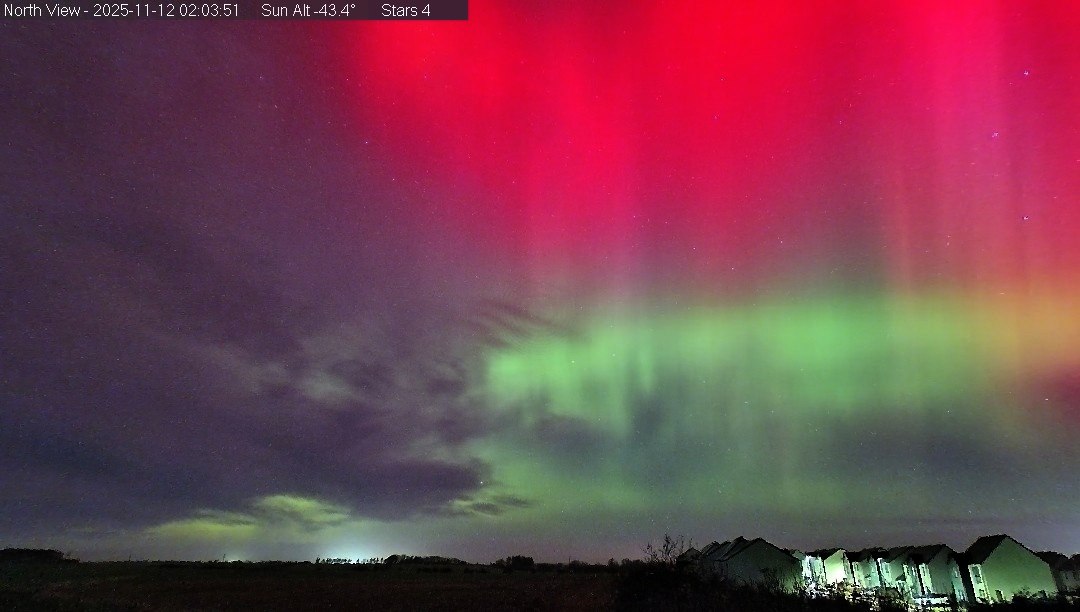
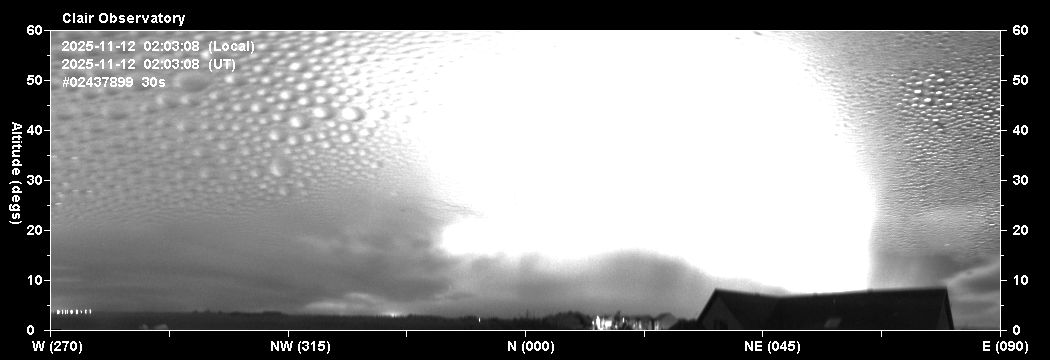
| 2025-11-12 02:03 UT (GMT) Auroral |
 |
 |
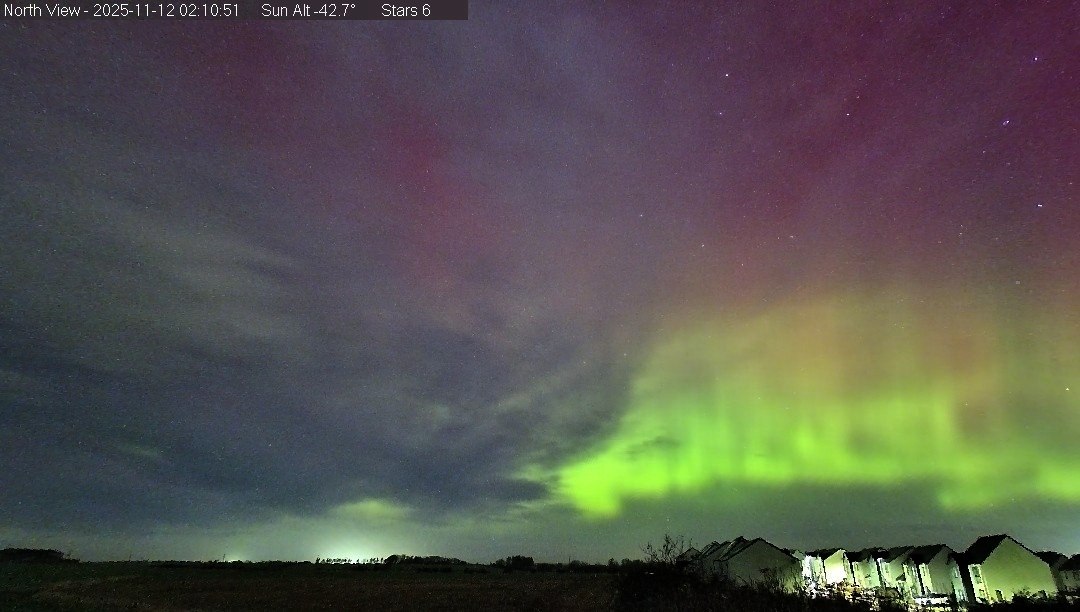
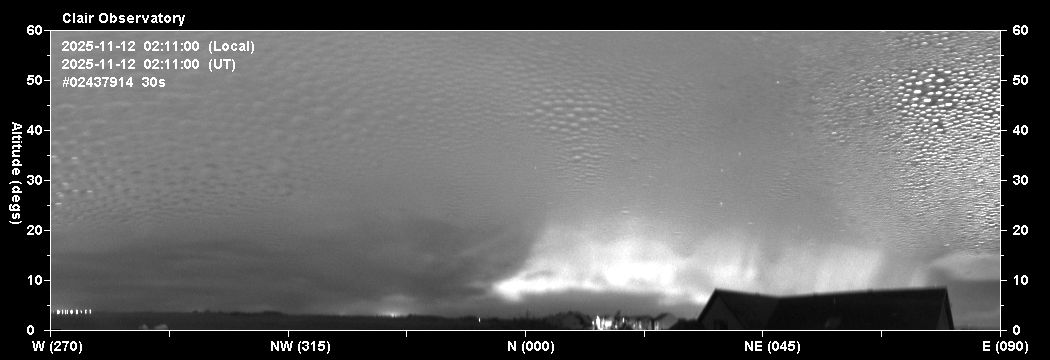
| 2025-11-12 02:11 UT (GMT) Auroral |
 |
 |
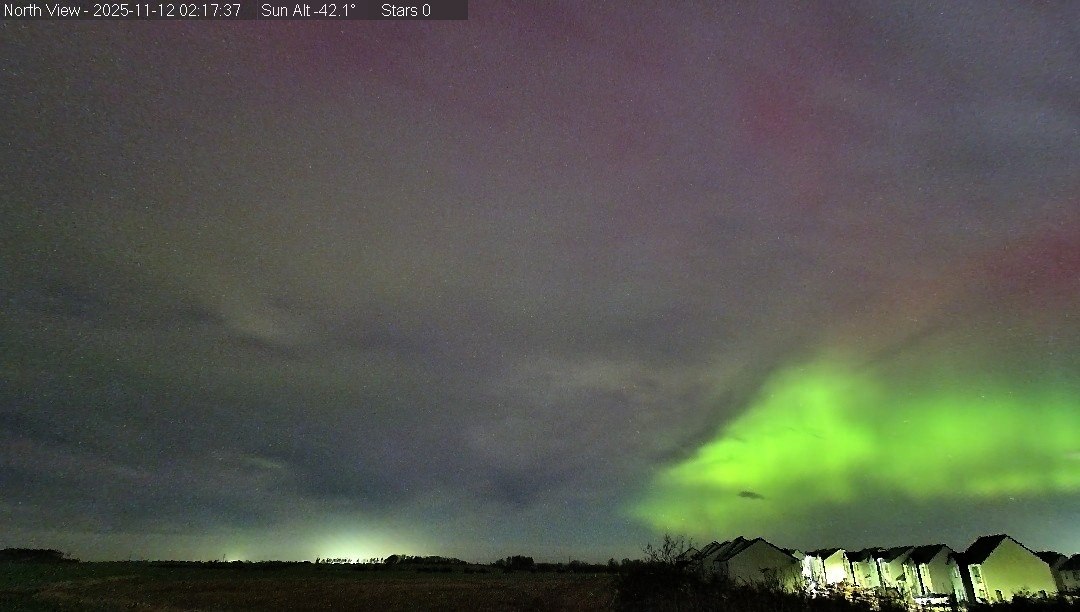
| 2025-11-12 02:17 UT (GMT) Aurora |
 |
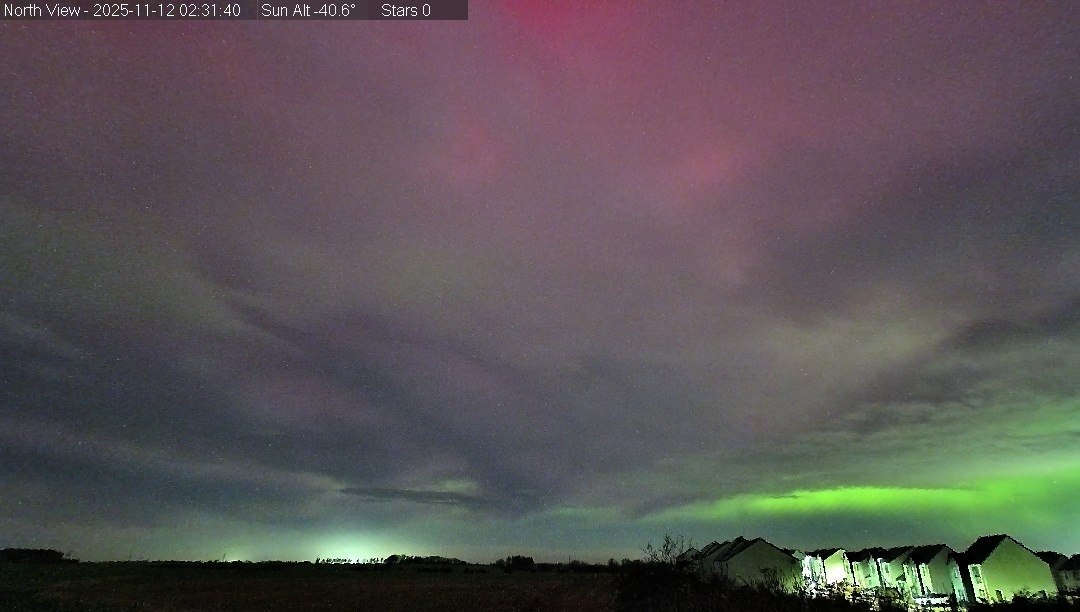
| 2025-11-12 02:31 UT (GMT) Aurora |
 |
| 2025-11-12 03:04 UT (GMT) Aurora |
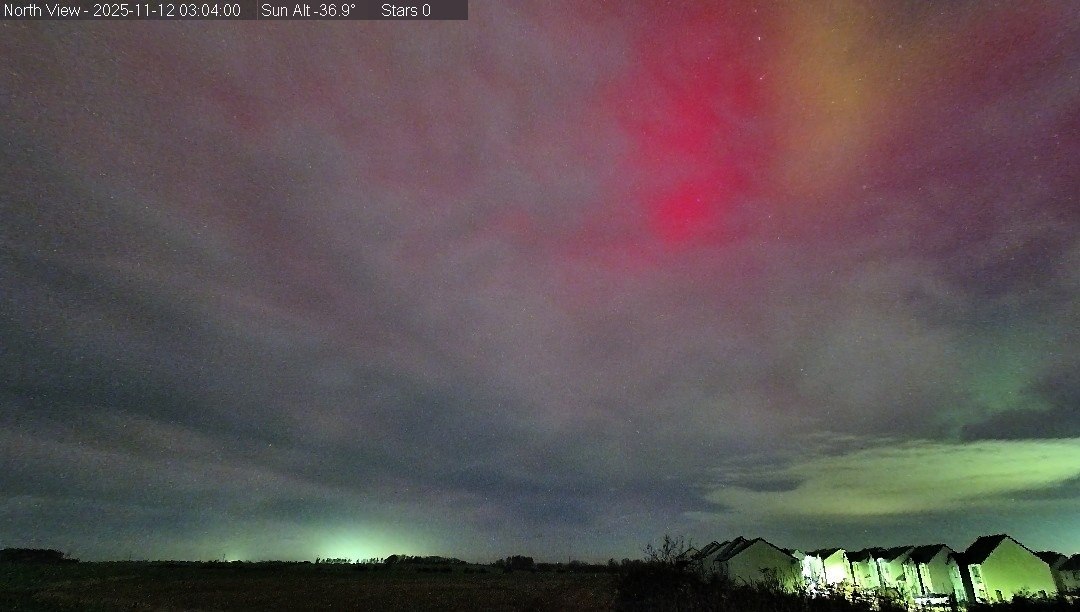 |
| 15s frames taken with Tapo C325WB Colour Camera
vs 30s wider-field exposures taken with Oculus All Sky Camera |
Back to Top
| Video: North Cam view, 9.0 hr
period 2025-12-12 17:00 to 2025-12-13 02:00 UT (GMT) |
| Link to .mp4 video file (12.8 MB) |
|
0.0s
/ 0.0s
|
| Video: North panoramic view, 8.5 hr
period 2025-12-12 17:00 to 2025-12-13 01:30 UT (GMT) |
| Link to .mp4 video file (10.8 MB) |
|
0.0s
/ 0.0s
|
Back to Top
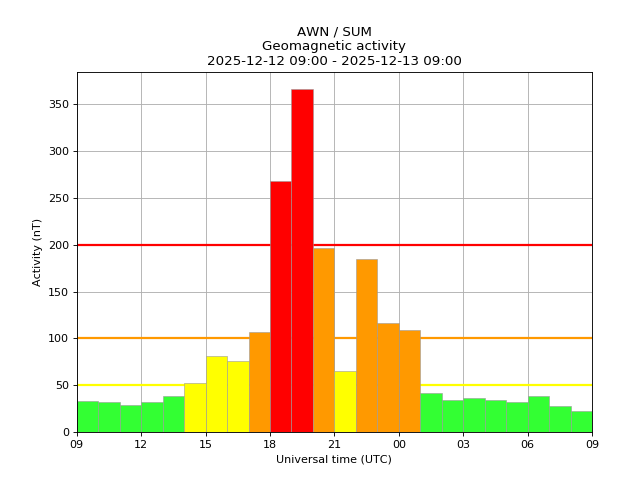
| Magnetometer Stack Plots from Scandinavia
(ordered by latitude) H Component - 2025-12-12 / 2025-12-13 Activity from 15:00 to 02:30 UT with initial peak of activity at 18:30-20:30 UT, with further peak in activity at 22:15 to 00:30 UT Note: Geomagnetometer activity at rvk (Rorvik, 64.95N), dob (Dombas, 62.07N), sol (Solund, 61.08N) and kar (Karmoy, 59.21N) stations are used as indicators for potential auroral activity that may be visible from my Observatory situated at latitude 57.32N (Map of Stations) |
 |
|
Graphed using 'make your own graph' facilities at
https://flux.phys.uit.no/compose/ (Tromsø Geophysical
Observatory ) Original data from Tromsø Geophysical Observatory (TGO), DTU Space (Technical University of Denmark) and Finnish Meteorological Institute (FMI) Data also displayed on SpaceWeatherLive's Europe Stackplot at http://www.spaceweatherlive.com/en/auroral-activity/magnetometers). Clair Observatory data below at same scale. |
Back to Top
|
Estimated 3 hour Planetary K-Index (NOAA) (from http://services.swpc.noaa.gov) Planetary-k-index_ 2025-12-12 / 2025-12-13 Not captured |
|
SAMNET's magnetometer at Sumburgh, Shetland
(Chart
Explanation) - Geomagnetic activity on the night 2025-12-12 / 2025-12-13 Plot shows elevated activity from17:00 to 01:00 UT with peak activity at a19:00-20:00 UT |
 |
|
8-day Lerwick Observatory K Index Showing max K5 on the night 2025-12-12 / 2025-12-13 |
 |
|
Planetary K-Index and other information (Space Weather
Prediction Centre) shows maximum Kp5- during the night 2025-12-12 / 2025-12-13 |
 |
Back to Top
|
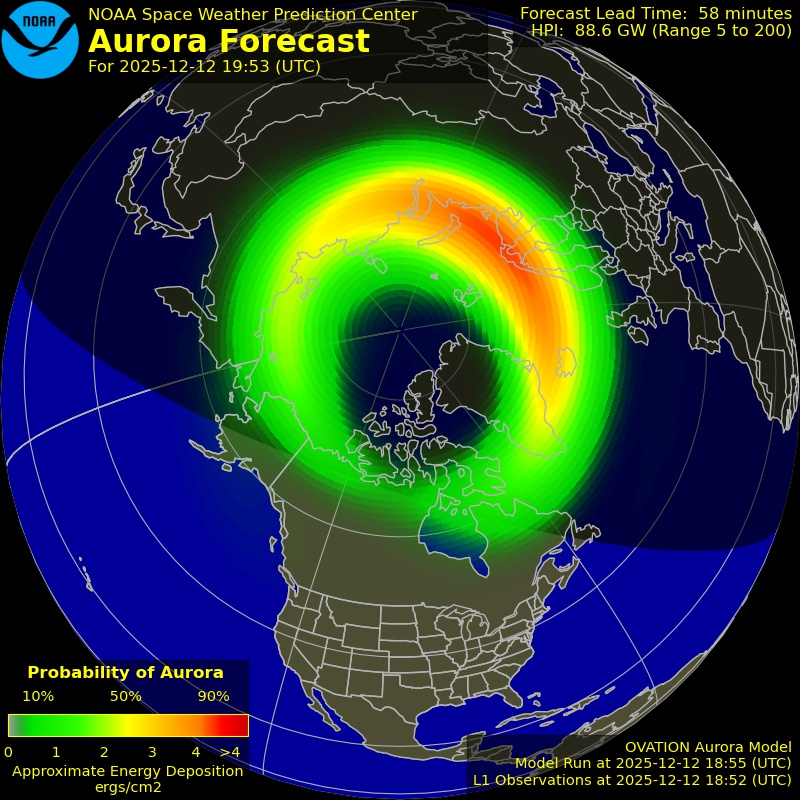
Aurora Forecast for 2025-12-12 19:53 UT (From Space Weather Prediction Centre, http://www.swpc.noaa.gov ) |
 |
Back to Top
| This Web Page: | Aurora - 2025-12-12 / 2025-12-13 |
| Last Updated : | 2026-03-07 |
| Site Owner : | David Richards |
| Home Page : | David's Astronomy Web Site |