David's Astronomy Pages
Notes - Session 1329 (2025-05-25)
Notes
(S1329A)
Notes
Main
Home
Page
Notes
(S1330)
David's Astronomy Pages
|
Notes (S1329A) |
Notes Main |
Home Page |
Notes (S1330) |
Main aims
Equipment & Software
Highlights
Summary Plots & Logs
|
Observing Plan Observing Plan not created for this session |
||||||||||||||||||||||||||||||||||||||||||||||||||||||||||||||||||||||||||||||||||||||||||||||||||||||||||||||||||||||||||||||||||||||||||||||||||||||||||||||||||||||||
|
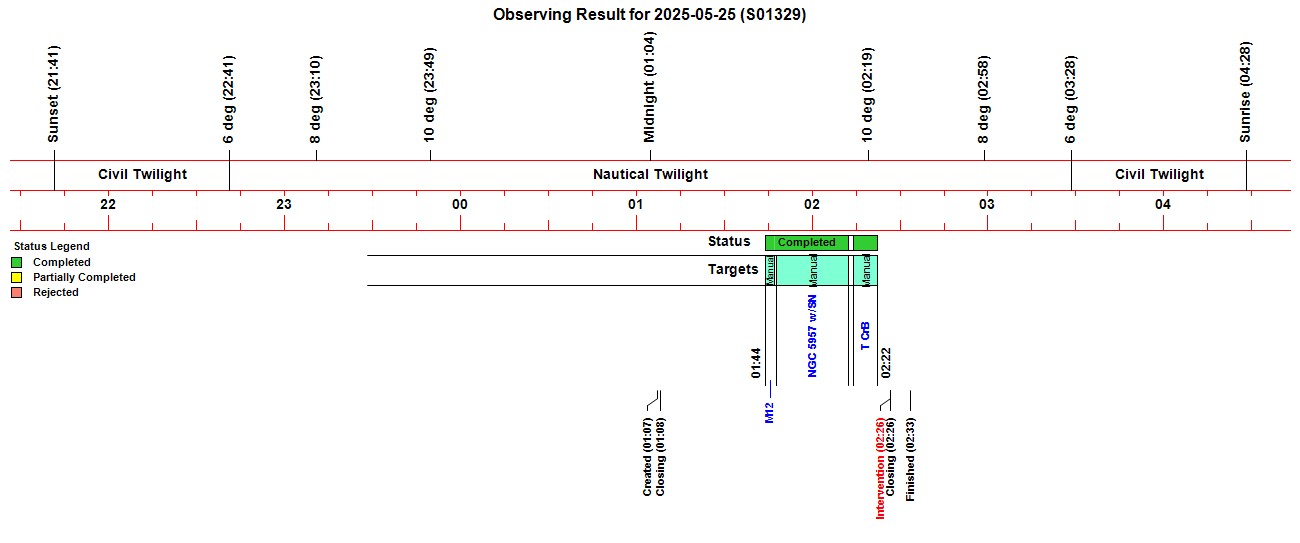
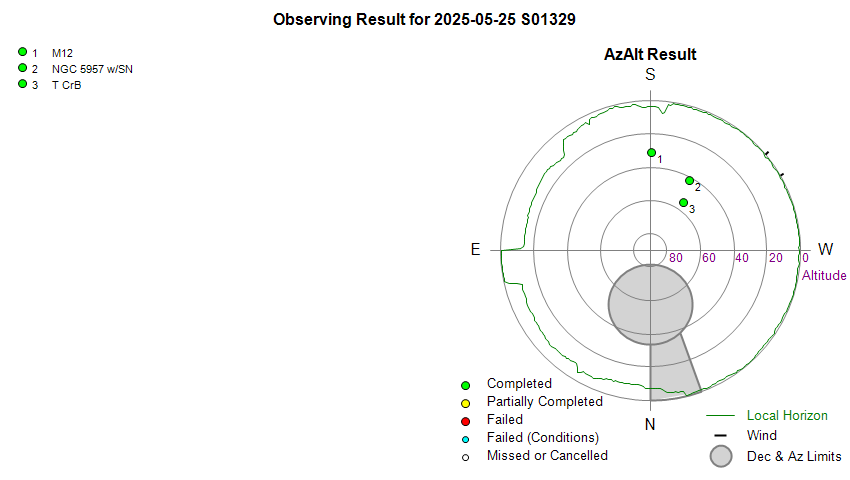
Observing Result |
||||||||||||||||||||||||||||||||||||||||||||||||||||||||||||||||||||||||||||||||||||||||||||||||||||||||||||||||||||||||||||||||||||||||||||||||||||||||||||||||||||||||
 |
||||||||||||||||||||||||||||||||||||||||||||||||||||||||||||||||||||||||||||||||||||||||||||||||||||||||||||||||||||||||||||||||||||||||||||||||||||||||||||||||||||||||
 |
||||||||||||||||||||||||||||||||||||||||||||||||||||||||||||||||||||||||||||||||||||||||||||||||||||||||||||||||||||||||||||||||||||||||||||||||||||||||||||||||||||||||
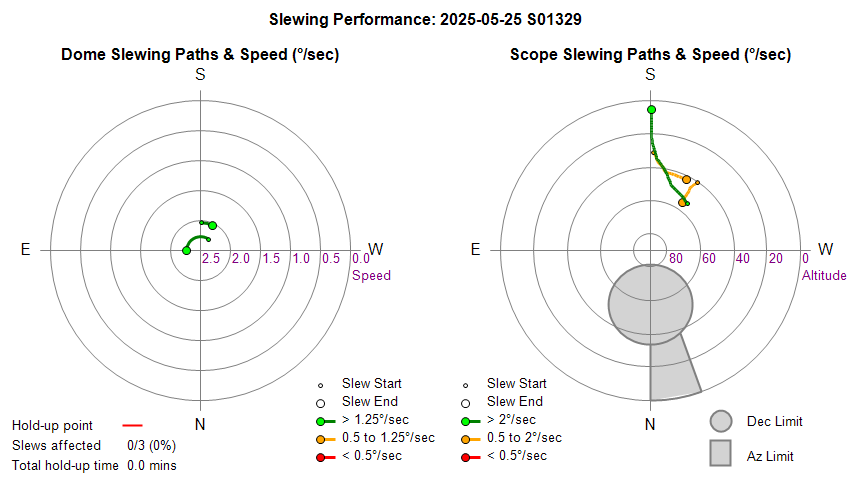
| Dome & Scope Slewing Performance | ||||||||||||||||||||||||||||||||||||||||||||||||||||||||||||||||||||||||||||||||||||||||||||||||||||||||||||||||||||||||||||||||||||||||||||||||||||||||||||||||||||||||
 |
||||||||||||||||||||||||||||||||||||||||||||||||||||||||||||||||||||||||||||||||||||||||||||||||||||||||||||||||||||||||||||||||||||||||||||||||||||||||||||||||||||||||
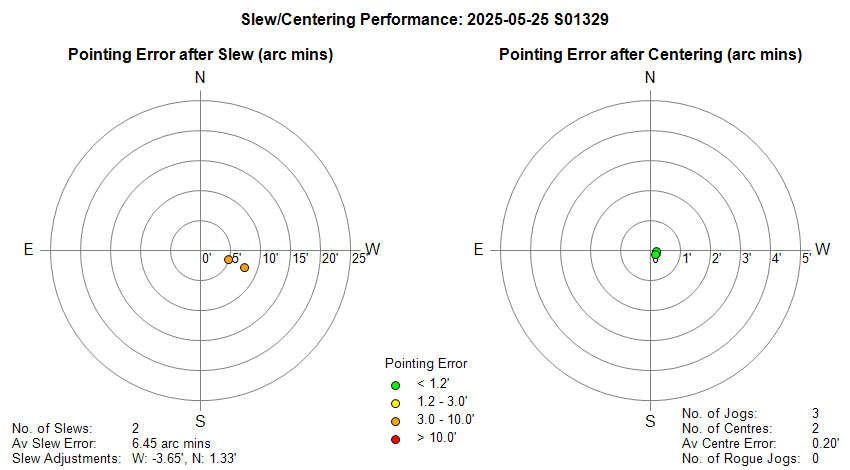
| Slew/Centering Performance | ||||||||||||||||||||||||||||||||||||||||||||||||||||||||||||||||||||||||||||||||||||||||||||||||||||||||||||||||||||||||||||||||||||||||||||||||||||||||||||||||||||||||
 |
||||||||||||||||||||||||||||||||||||||||||||||||||||||||||||||||||||||||||||||||||||||||||||||||||||||||||||||||||||||||||||||||||||||||||||||||||||||||||||||||||||||||
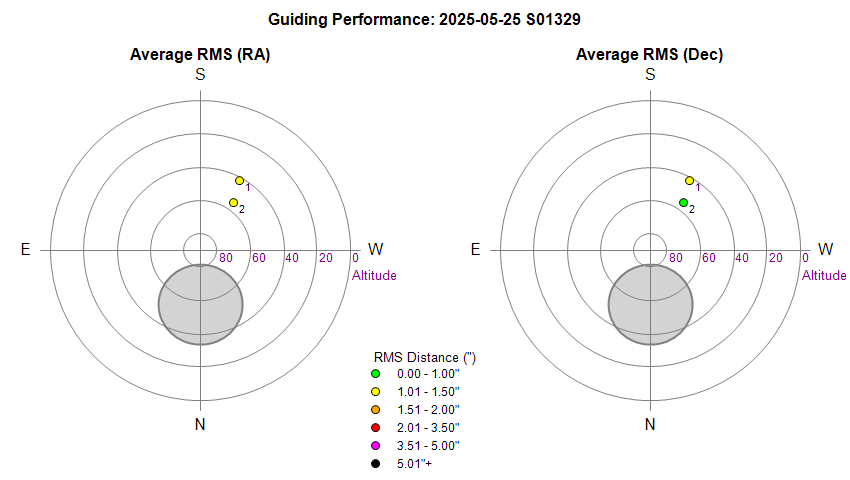
| Guiding Performance | ||||||||||||||||||||||||||||||||||||||||||||||||||||||||||||||||||||||||||||||||||||||||||||||||||||||||||||||||||||||||||||||||||||||||||||||||||||||||||||||||||||||||
 |
||||||||||||||||||||||||||||||||||||||||||||||||||||||||||||||||||||||||||||||||||||||||||||||||||||||||||||||||||||||||||||||||||||||||||||||||||||||||||||||||||||||||
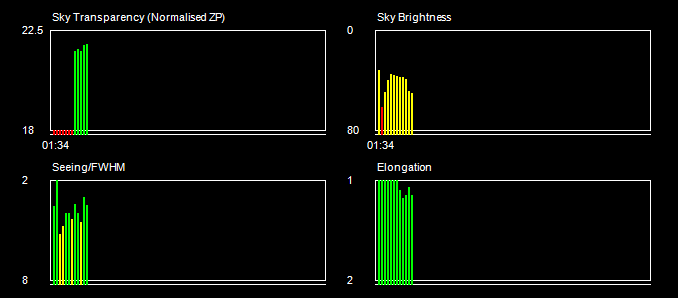
| Sky Conditions (Locate Frames) | ||||||||||||||||||||||||||||||||||||||||||||||||||||||||||||||||||||||||||||||||||||||||||||||||||||||||||||||||||||||||||||||||||||||||||||||||||||||||||||||||||||||||
 |
||||||||||||||||||||||||||||||||||||||||||||||||||||||||||||||||||||||||||||||||||||||||||||||||||||||||||||||||||||||||||||||||||||||||||||||||||||||||||||||||||||||||
|
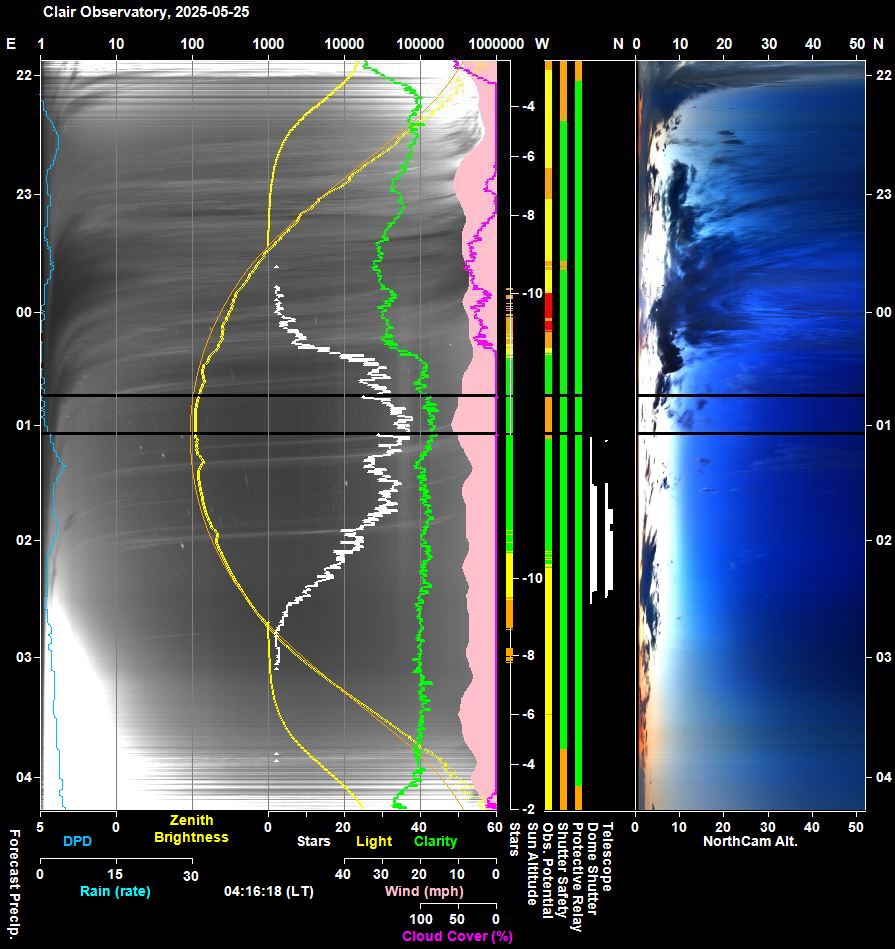
Night Sky Summary Plot Top axis: Sky Brightness at Zenith (in ADU/s) Lefthand axis: Local Time (hh LT). Righthand axis: Sun Altitude (degs) |
||||||||||||||||||||||||||||||||||||||||||||||||||||||||||||||||||||||||||||||||||||||||||||||||||||||||||||||||||||||||||||||||||||||||||||||||||||||||||||||||||||||||
 |
||||||||||||||||||||||||||||||||||||||||||||||||||||||||||||||||||||||||||||||||||||||||||||||||||||||||||||||||||||||||||||||||||||||||||||||||||||||||||||||||||||||||
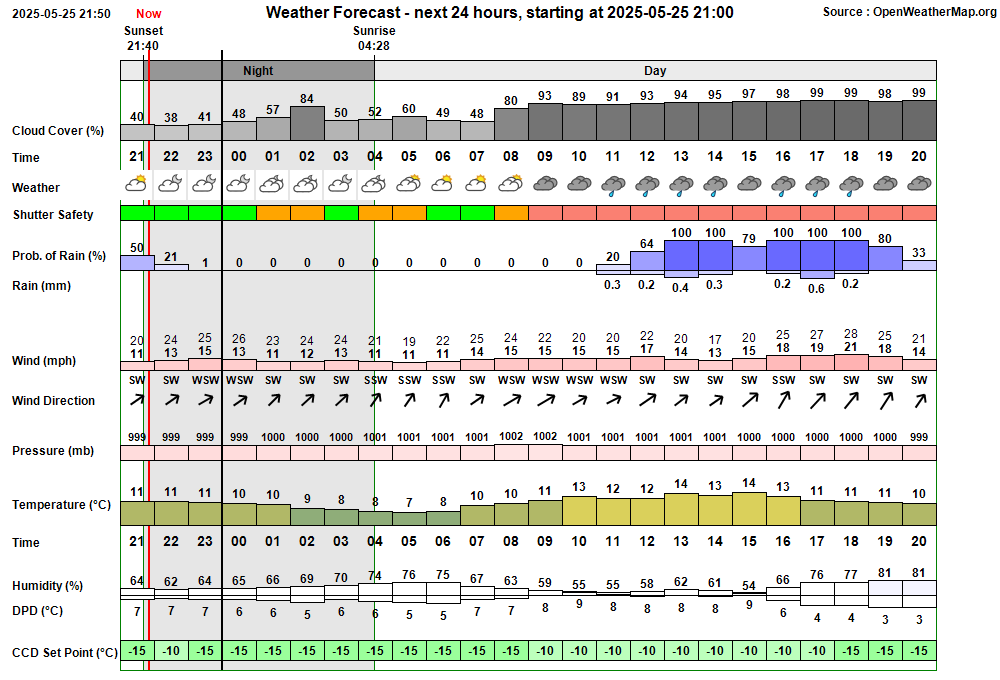
| Actual Weather vs Pre-Session Weather Forecast | ||||||||||||||||||||||||||||||||||||||||||||||||||||||||||||||||||||||||||||||||||||||||||||||||||||||||||||||||||||||||||||||||||||||||||||||||||||||||||||||||||||||||
 |
||||||||||||||||||||||||||||||||||||||||||||||||||||||||||||||||||||||||||||||||||||||||||||||||||||||||||||||||||||||||||||||||||||||||||||||||||||||||||||||||||||||||
 |
||||||||||||||||||||||||||||||||||||||||||||||||||||||||||||||||||||||||||||||||||||||||||||||||||||||||||||||||||||||||||||||||||||||||||||||||||||||||||||||||||||||||
| Session Event Log | ||||||||||||||||||||||||||||||||||||||||||||||||||||||||||||||||||||||||||||||||||||||||||||||||||||||||||||||||||||||||||||||||||||||||||||||||||||||||||||||||||||||||
|
||||||||||||||||||||||||||||||||||||||||||||||||||||||||||||||||||||||||||||||||||||||||||||||||||||||||||||||||||||||||||||||||||||||||||||||||||||||||||||||||||||||||
| Session Alerts & Alarms | ||||||||||||||||||||||||||||||||||||||||||||||||||||||||||||||||||||||||||||||||||||||||||||||||||||||||||||||||||||||||||||||||||||||||||||||||||||||||||||||||||||||||
|
||||||||||||||||||||||||||||||||||||||||||||||||||||||||||||||||||||||||||||||||||||||||||||||||||||||||||||||||||||||||||||||||||||||||||||||||||||||||||||||||||||||||
Back to Top
Back to Top Issue, Back to Top
Fig 1. SBIG Driver 'Operating system error' just after starting S1329 session (2025-05-26 01:25)
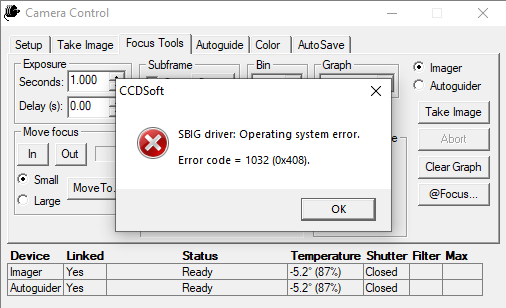
Fig 2. Magnetogram and Stackplot Charts showing anomalous accelerating increase in Y Axis reading leading to spike at 2025-05-26 07:30 .
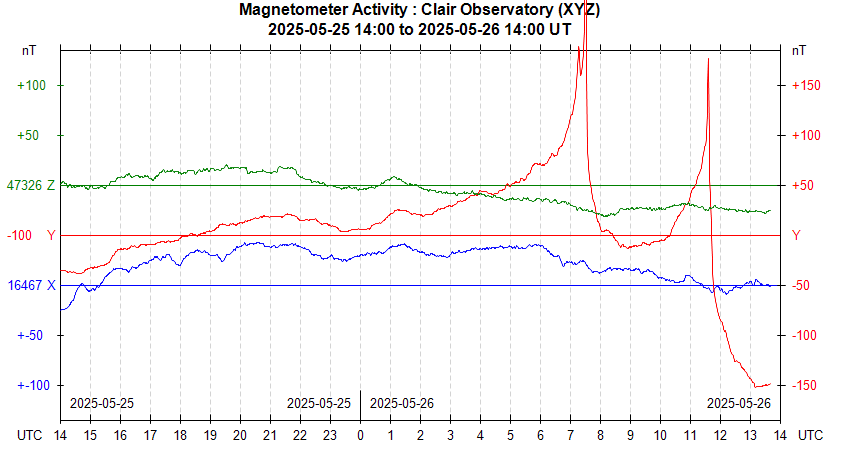
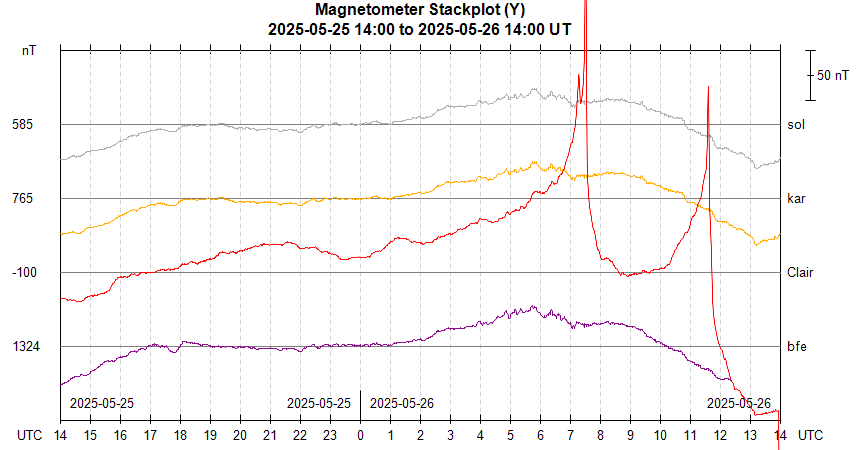
Fig 3. SAM III Magnetogram covering period with Y Axis Anomalies and (07:30 & 11:30) and restart of SAM III System (13:57)
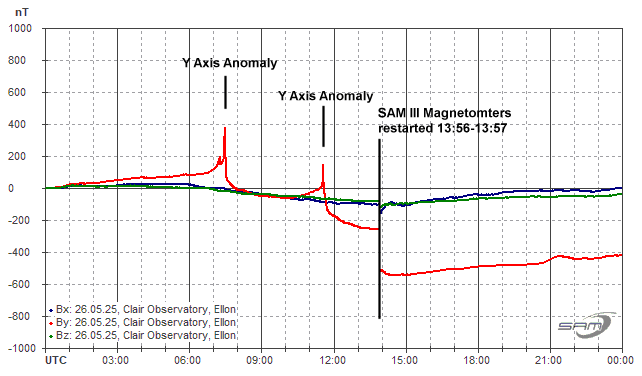
Fig 4. Apparent Temperature Effect from restarting SAM III Magnetometer at 13:56-13:37
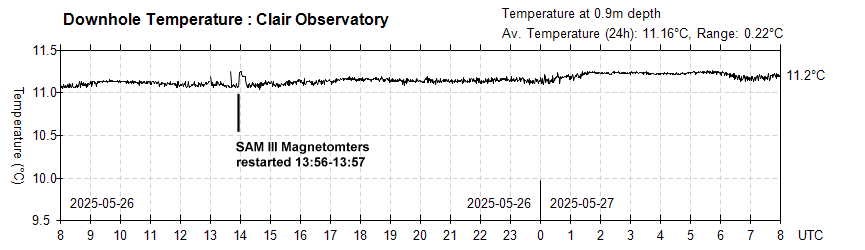
Fig 5. NorthCam picture with auto-detected object highlight by white box, but one very obvious (larger) bird hasn't been detected (2025-05-27 09:03)
Fig 5a. Original picture with obvious mising detection (large bird)

Fig 5b. Picture after fixes in AstroNorthCam 1.4.5

Fig 6. NorthCam
picture with an autodetected bird highlighted by several overlapping
boxes instead of a single box (2025-05-27 13:05)
FIg
6a. Original picture
with overlapping boxes, plus a couple of false-positive detections
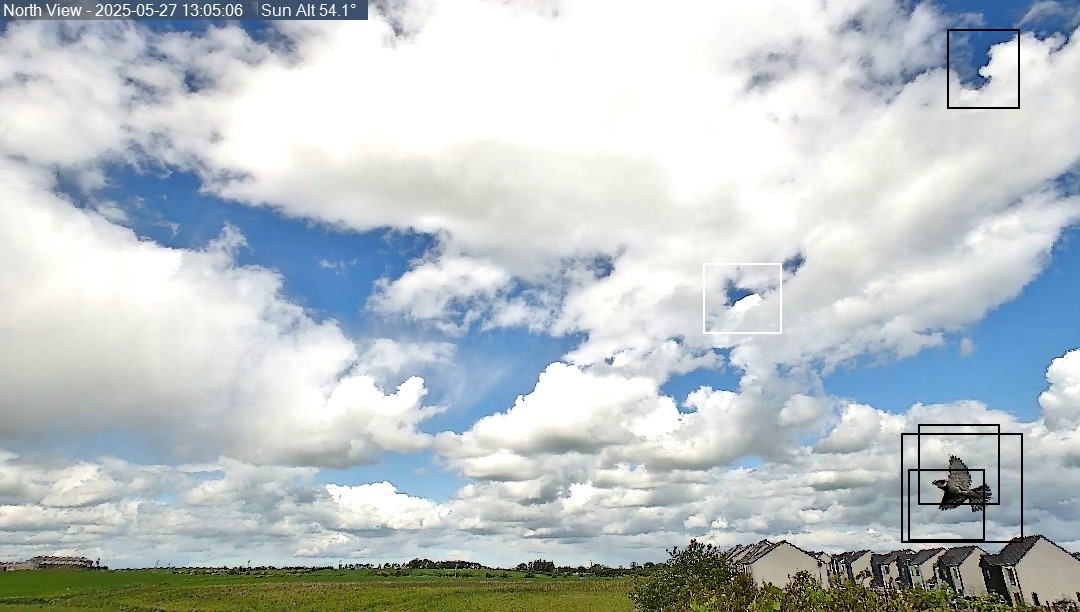
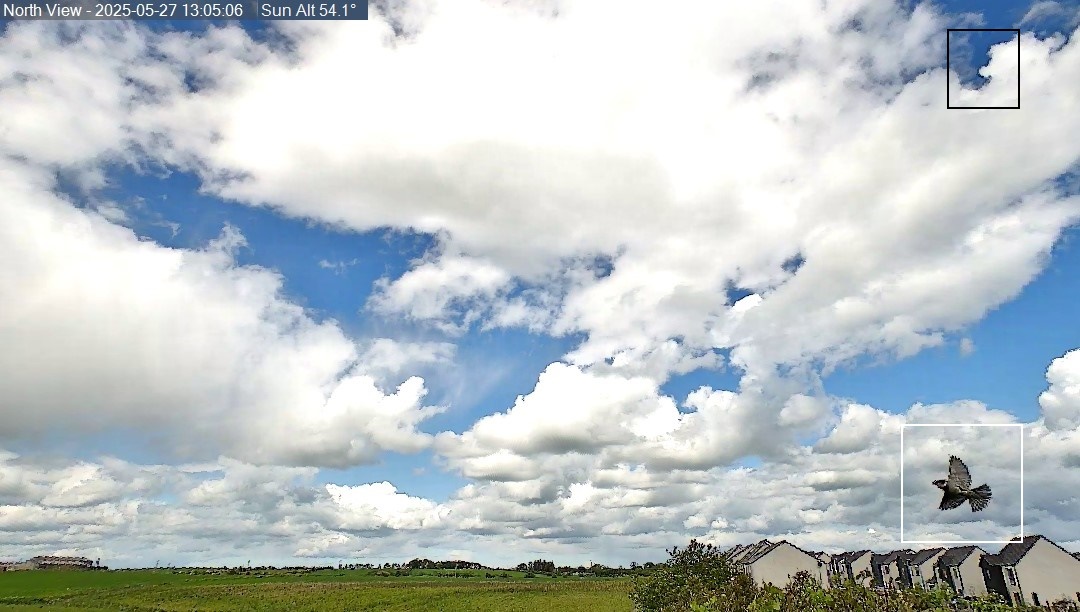
FIg 6b. Picture after fixes in AstroNorthCam 1.4.3
Back to Top Issue, Back to Top
A Geomagnetic Monitoring Station has been added to the Observatory in
Spring 2025 for
monitoring changes in the earth's magnetic field and to supplement and build
upon the Observatory's existing Aurora monitoring that uses a Black/White AllSky Camera
(2014+) and a new NorthCam Colour Camera (2024+)
The following notes
describes a Anomalies that have occured since the SAM III
system went into operation on 2025-05-14.
Other notes :
|
Review |
SAM III
| Site Prep
| Assembly
Design |
Parts
Assembly | Testing |
Final
Assembly |
|
Installation
|
Commissioning |
Remedial
Fix |
Operation |
Anomalies |
GA Tool |
Remedial Fix
2 |
After a protracted commissioning, diagnosis and remedial period, the
Observatory's Geomagnetic Station finally deemed to have entered into
Operation on 2025-05-14.
Remaining Issues
Some residual issues remain, as
shown during the period 2025-05-23 to 2025-05-26. Problems seem to be
resolved (temporarily at least) by restarting the SAM III box (i.e. power-off
/ power on). Issue with temperature correction are also noted (see
GA Tool,
2025-06-08)
Notes
1) 2025-05-23 - Y Axis Anomaly
2)
2025-05-24 to 25 - Anomalies in magnetometer
readings
3) 2025-05-26 - Magnetometer
Anomalies (Y Axis)
4)
2025-06-07 - Effect from a metal garden spade in
proximity to the magnetometer sensors
5)
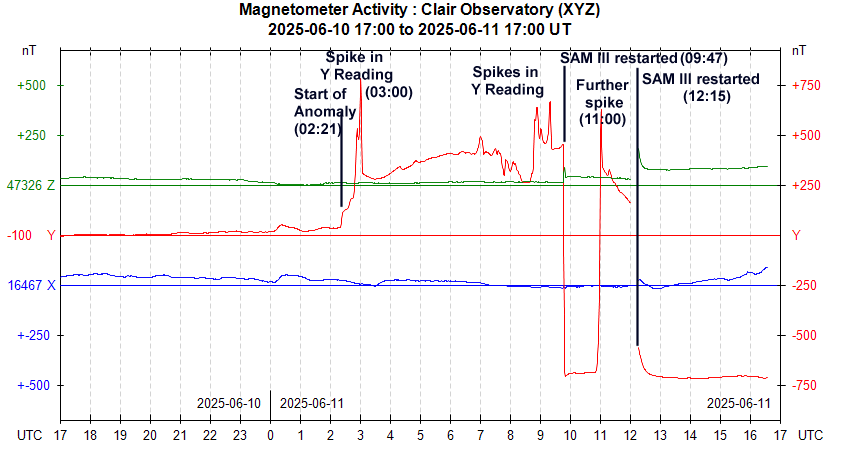
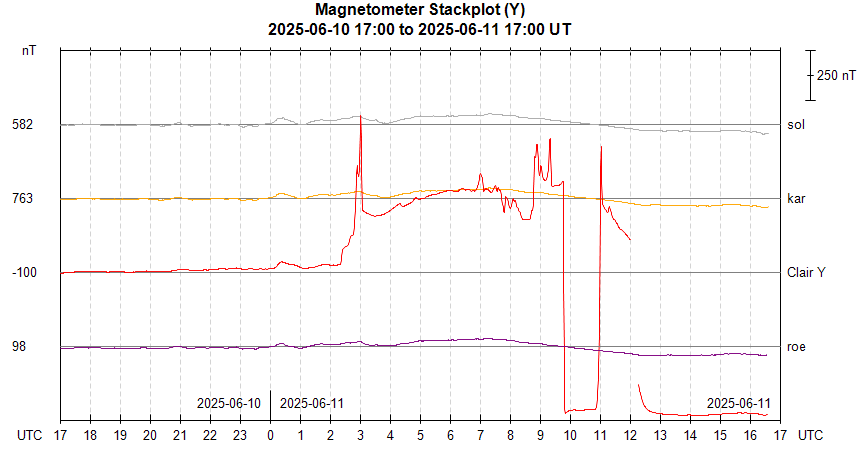
2025-06-11 - Magnetometer Anomalies (Y Axis)
6)
2025-06-13 - Subsurface Temperature Anomaly
coincident with Major Geomagnetic Event (2025-06-13 00:00)
7)
2025-06-14 - Anomalous magnetometer trends
(2025-06-14 13:00-22:00 UT)
8) 2025-06-20 -
Y Axis Anomaly
9) 2025-06-22 - X,Y,Z Axes
Anomaly
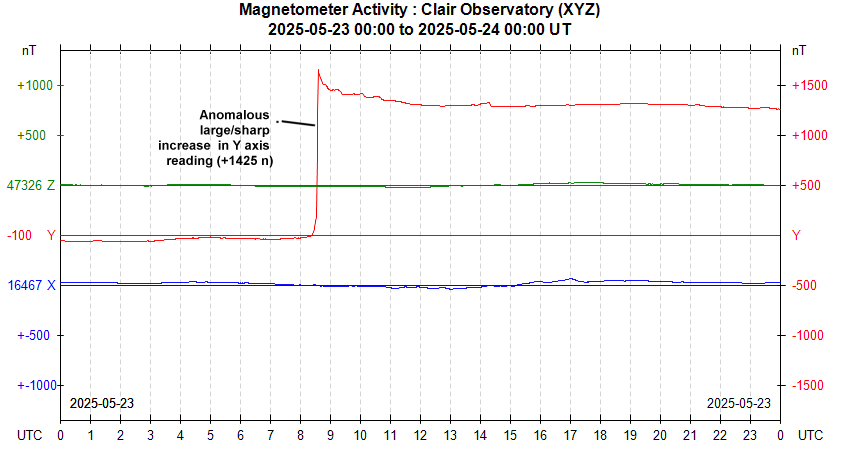
1) 2025-05-23 - Y Axis Anomaly
Anomalous large/sharp increase in Y Axis reading (2025-05-23 08:34 UT)
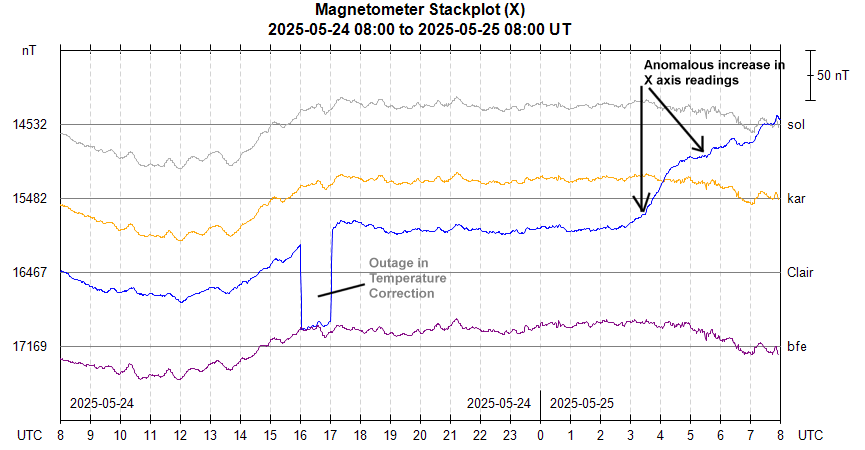
2) 2025-05-24 to 25 - Anomalies in
magnetometer readings
a) shift due to outage in
temperature correction (temperature data absent) c. 16:00-17:00 UT
b)
unexplained increase in X/Y readings at 03:00 UT

Comparison between X Axis Readings and those from Scandinavian Stations demonstrates the anomaly
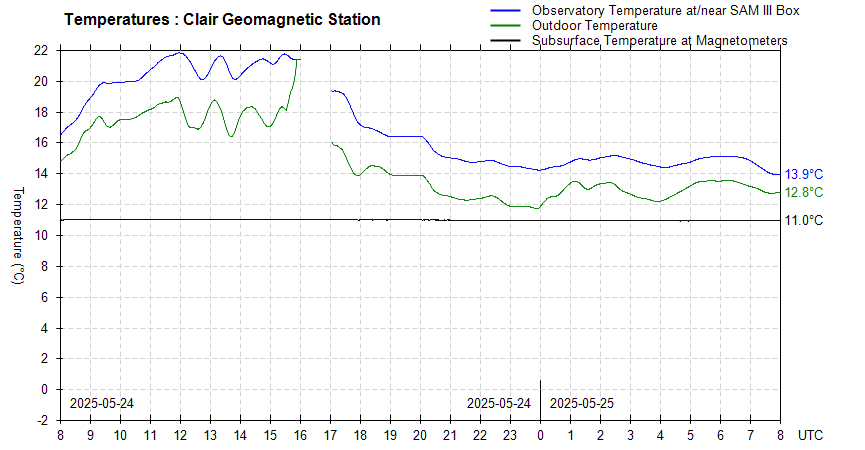
Temperature data over the same period as graphs show that issue is unrelated to temperature

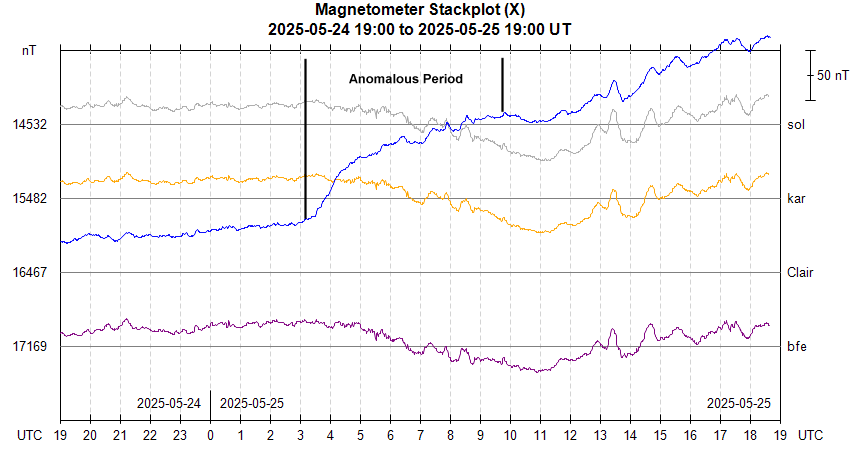
Comparison between X Axis Reading and those at Scandinavian Stations shows the anomalous period before curves become semi-parallel again at around 10:00
Rain data covering the same period (peak rain appears to have been at around 03:30 and this seems to correspond with about the time that the anomaly in X readings was increasing rapidly.
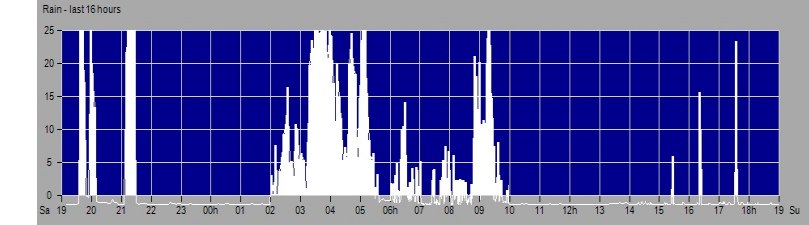
A plausible hypothesis is that cold rain water quickly soaked into the ground and cooled subsurface temperatures affecting the magnetometer data. This is not unreasonable given the magnetometer's relatively large temperature coefficient of -100 to -150 nT/°C. However the absence of any evidence of significant cooling from the colocated temperature sensor doesn't support the hypothesis.
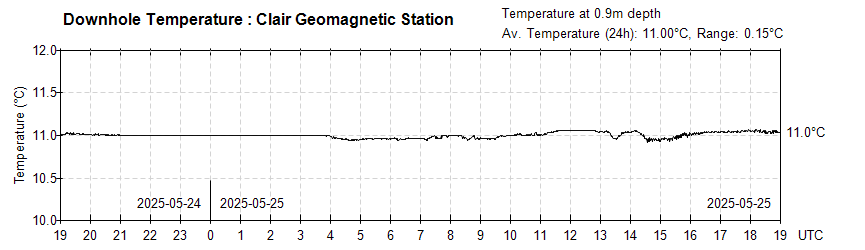
Y and Z readings also show anomalous periods but they seem to be delayed
relative to the readings from the X (shallowest) sensor
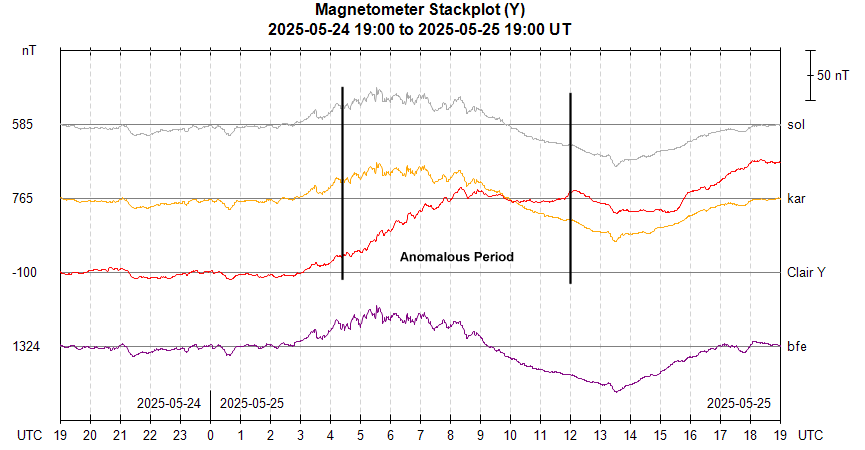
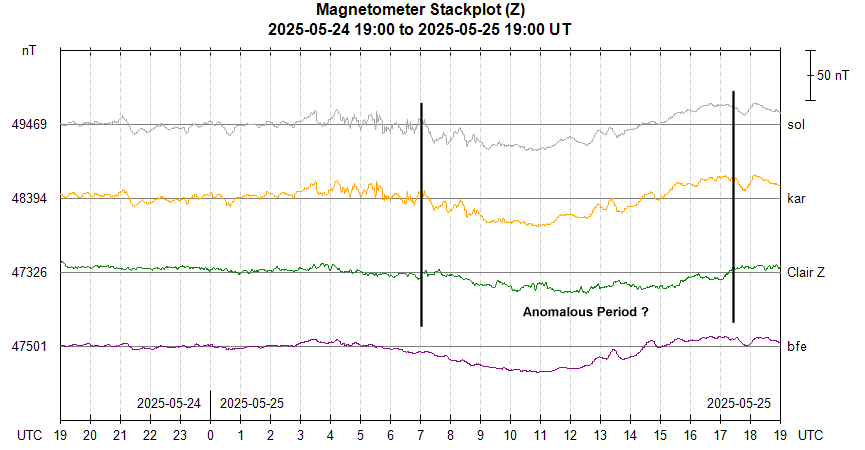
The time
interval showing the anomalous X & Y magnetometer trends is highlighted
on the chart.
As can be seen there is no obvious feature
in the downhole temperature graph to explain the anomaly.
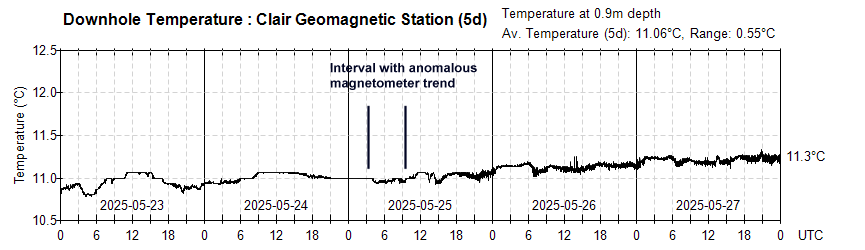
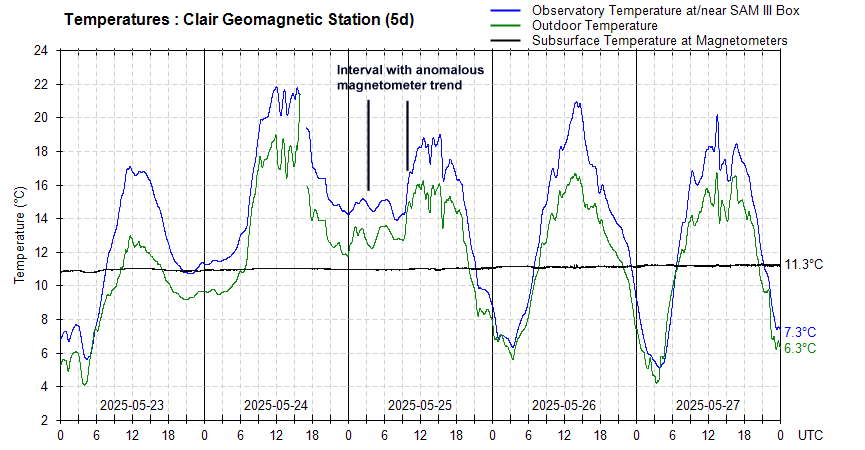
Chart below shows the Outdoor and Observatory Temperature measured over
the same period
The time interval showing the anomalous X & Y
magnetometer trends is highlighted on the chart.
The
interval is noticeably much warmer than the equivalent time interval on
other nights/early mornings.
3) 2025-05-26 - Magnetometer Anomalies (Y Axis)
Magnetogram and Stackplot Charts showing anomalous accelerating increase in Y Axis reading leading to spike at 2025-05-26 07:30 .
SAM III Magnetogram covering period with Y Axis Anomalies and (07:30 & 11:30) and restart of SAM III System (13:57)
Apparent Temperature Effect from restarting SAM III Magnetometer at 13:56-13:37
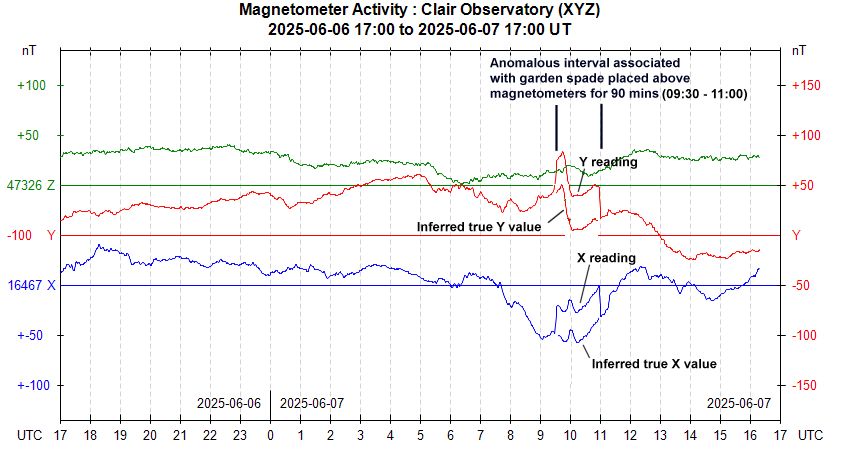
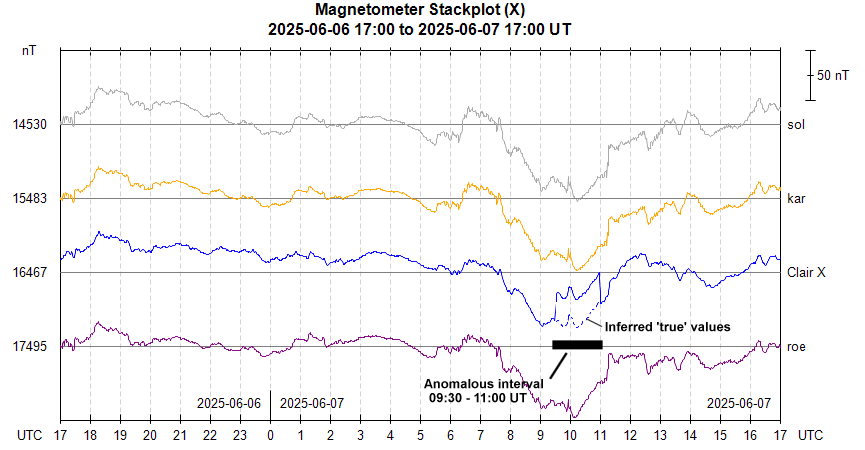
4) 2025-06-07 - Effect from a metal garden spade in proximity to the magnetometer sensors
After noticing some possible artefacts in magnetometer reading whilst digging a new garden bed around 3m from the buried magnetometers a test was performed on 2025-06-07 in which a garden spade was placed above the buried magnetometers for a 90 min period between 09:30 and 11:00 UT. The station's magnetogram shows a clear increase in X & Y readings when the spade was placed above the location of the magnetometer at 09:30 UT and then a sharp decrease when the spade was removed at 11:00 UT. There was no obvious deflections in readings from the more deeply buried Z sensor. The magnetogram below has been annotated with the inferred 'true' magnetometer values which would be consistent with Comparison Stations.
5) 2025-06-11 - Magnetometer Anomalies (Y Axis)
16 days after the last major anomalies with Y axis readings (2025-05-26) there was a further major bout of anomalies that started at 2025-06-11 02:21 and culminated in large spike (with a total offset of 750nT) at 03:00. The offset shift continued and there was further spiking at around 09:00. The SAM III box and magnetometer were reset at 09:47 with a power off time of around 30s, as this has previously fixed the issue. However just 73 minutes later at 11:00 there was a further large spike in Y readings. The SAM III box and magnetometers were turned off at around 12:00 and then restarted at 12:15 (ie a power-off time of around 14 mins). This appears to have resolved the issue (for the time being).
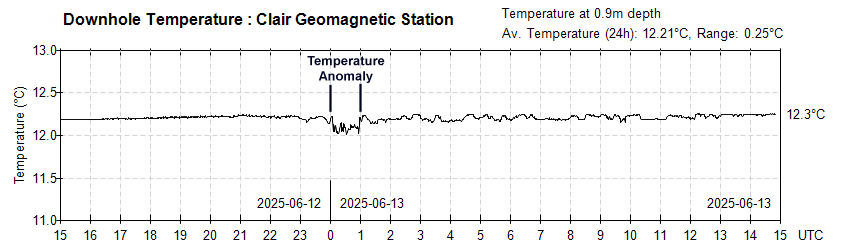
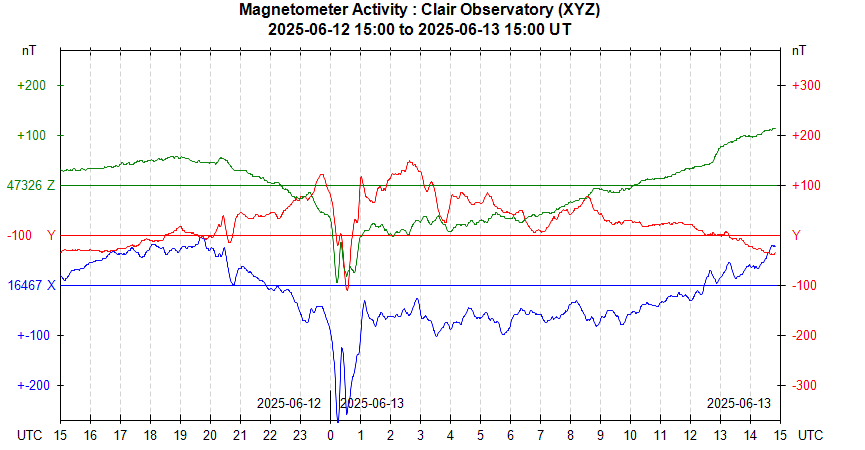
6) 2025-06-13 - Subsurface Temperature Anomaly coincident with Major Geomagnetic Event (2025-06-13 00:00)
Subsurface Temperatures measured using a DS18B20 Temperature Sensor Probe co-located with the Magnetometer Sensor show an anomalous 0.2°C reduction in temperature for a period of 1 hour on 2025-06-13 (between 00:00 to 01:00 UT). This appears to be precisly coincident with the peak of a major geomagnetic event. Rather than a real reduction in temperature it is hypothesized that this an effect of cross-talk / interference with the electric signals passing in the wires from Magnetometer Sensors that run parallel to the Temperature Sensor cable for 10m back to the Observatory or within buried Sensor Assembly itself.
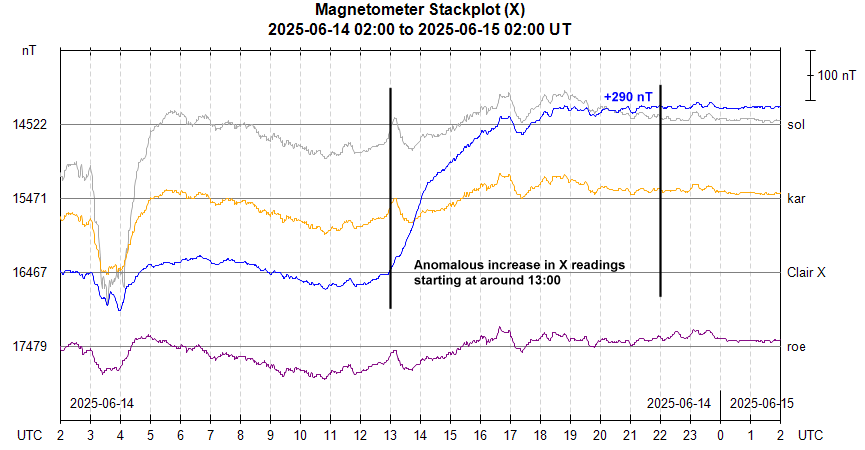
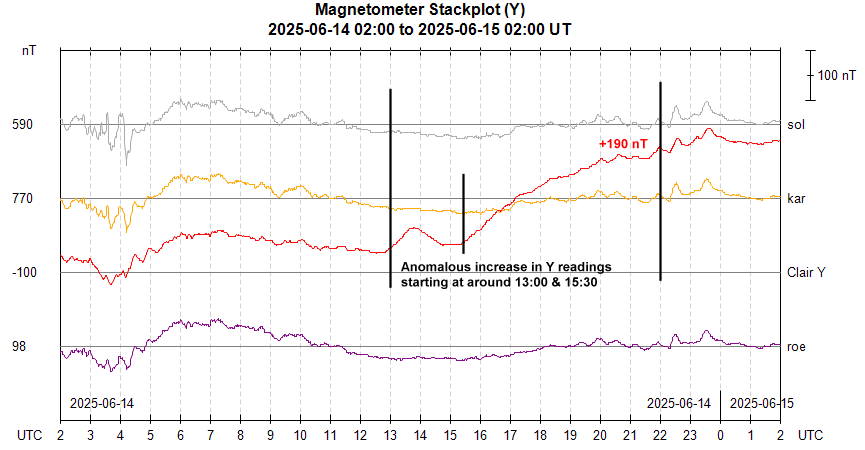
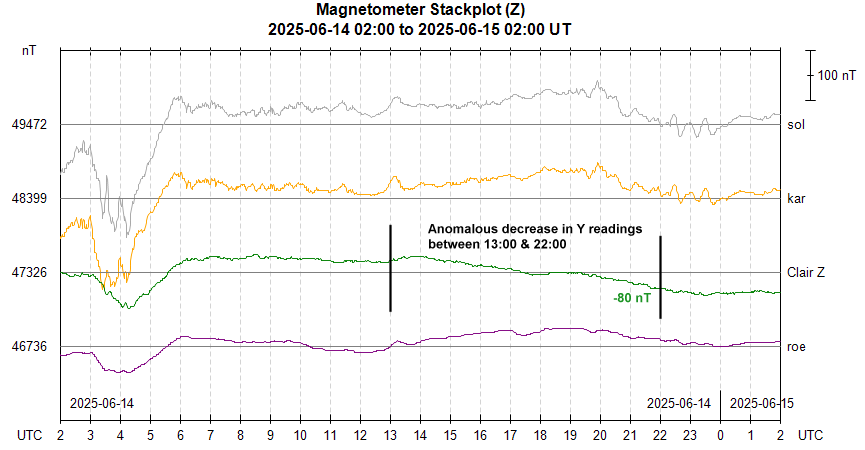
7) 2025-06-14 - Anomalous magnetometer trends (2025-06-14 13:00-22:00 UT)
Magnetogram Stackplots showing anomalous trends in X,Y, Z readings from
the Clair station (2025-06-14 13:00-22:00 UT) are shown below.
They
show the following features
- anomalous 290nT increase
in X (shallowest sensor), with majority of increase happening between 13:30
and 16:00 UT.
- anomalous 190nT increase in Y (middle sensor), with
majority of increase happening between 15:30 and 20:00 UT.
- anomalous 80
nT decrease in Z (deepest sensor), with majority of decrease happening
between 14:00 and 18:00 UT.
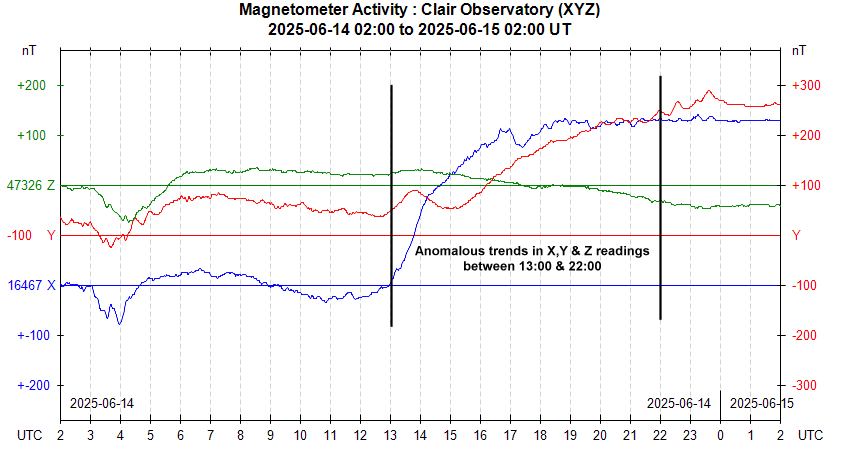
Graph showing magnetometer readings from all 3 axis over the same time
period is shown below.
- The interval with anomalous magnetometer
trends from 13:00-22:00 UT is highlighted.
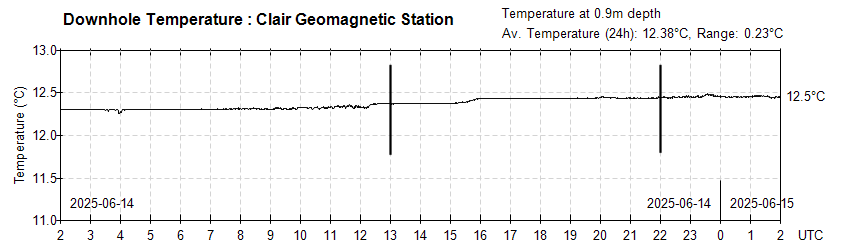
Subsurface Temperatures over the same period are shown in graph
below
- Temperatures are measured from a sensor probe that is positioned just
above the Y magnetometer.
- The anomalous 290 nT increase in X readings
(190 nT increase in Y readings) would typically be explained by a cooling in
the temperature at the magnetometer sensors, however the co-located temperature
sensor doesn't see any cooling over the period 13:00-22:00 UT and in fact
appears to see a 0.1°C increase in temperature !
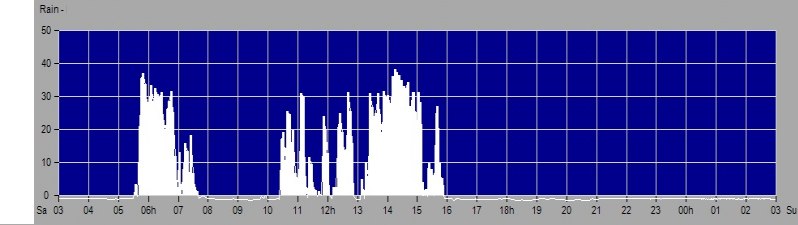
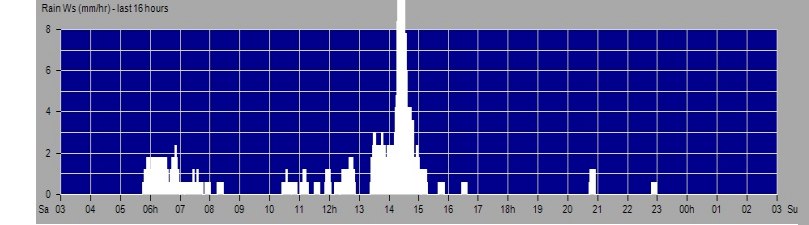
Rain rates/amounts over the same period are shown in graphs below
- Rain graphs from same period. Note that time scale is BST (= UT
+1h)
- Rain detection from Eurotech CloudSensor (top)
- Rain rate from Haptic Sensor on Ecowitt Weather Station (bottom)
-
Highest rain rate (~ 9mm/hr) occurs at 14:15-14:30 BST (= 13:15 to 13:30 UT)
- Highest rain rate corresponds to the start of period with anomalous
magnetometer readings (13:00 to 22:00 UT)
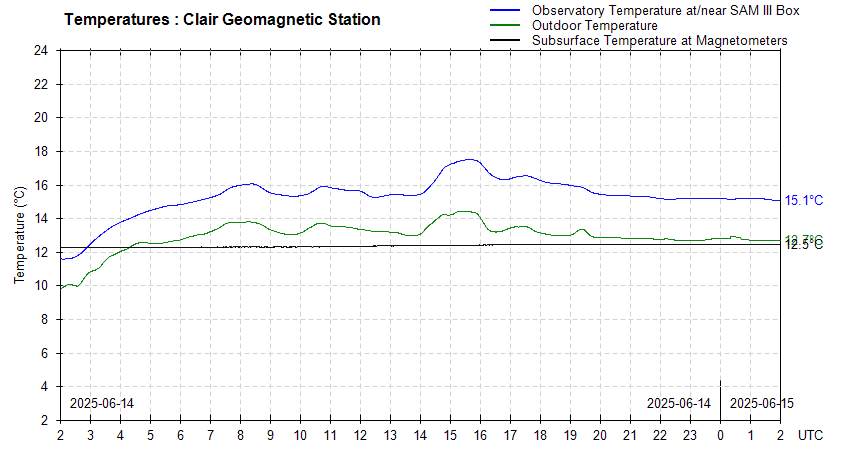
At the time of the
highest rain rate (c 13:15 UT) the outdoor air temperature (green line) was
around 13°C
- This was around 0.5°C than the subsurface temperature
(12.4°C)
- The temperature of rain water could easily have been colder
than this.
- But how is that cold rain water was able to
cool the region around X and Y magnetometers without causing any temperature
decrease in the co-located temperature sensor ?
Are the magnetometer readings being changed because of a
temperature change or due to the presence of increased water in the soil
surrounding the buried magnetometer assembly ?
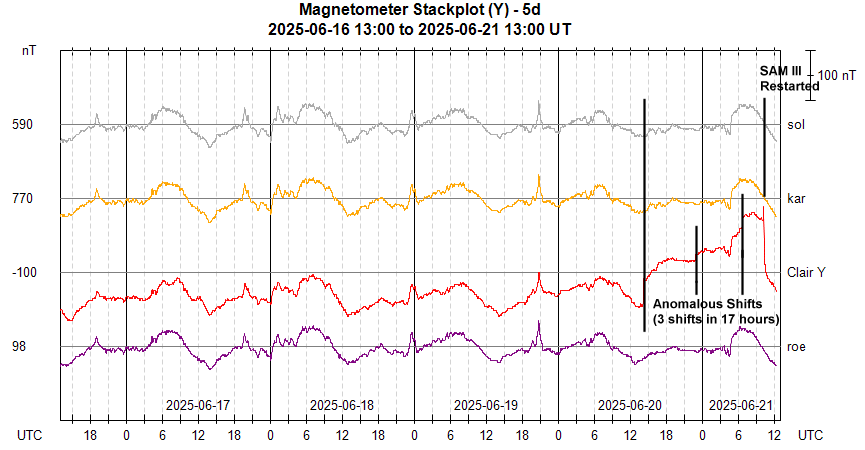
8) 2025-06-20 - Y Axis Anomaly
- Y
axis stackplot below shows 3 anomalous shifts in Clair Station's Y readings
over the course of 17 hours.
- X and Y readings are unaffected
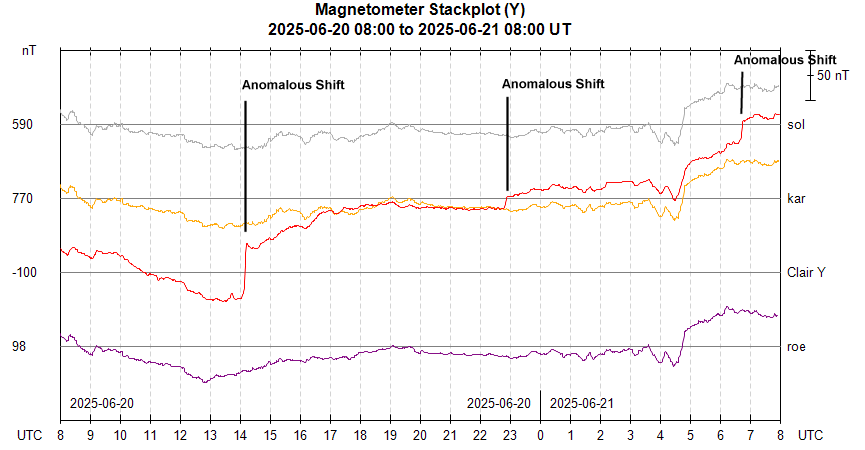
SAM III was powered off on the morning 2025-06-21 and then restarted again after a 5 minute wait period.
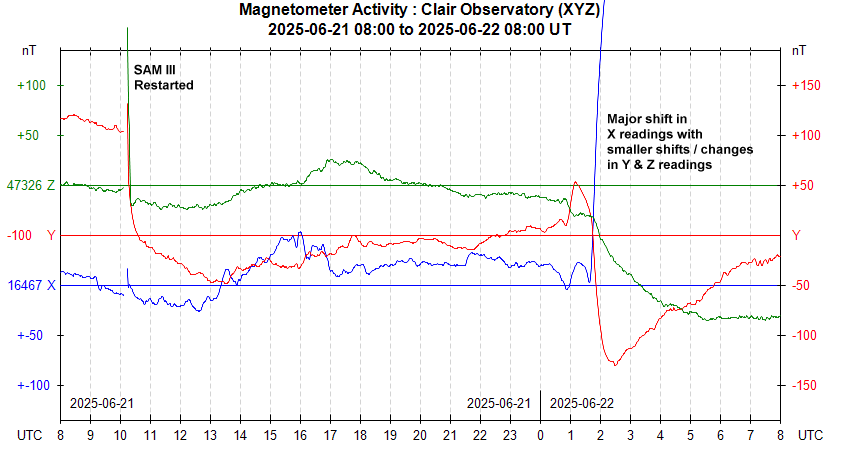
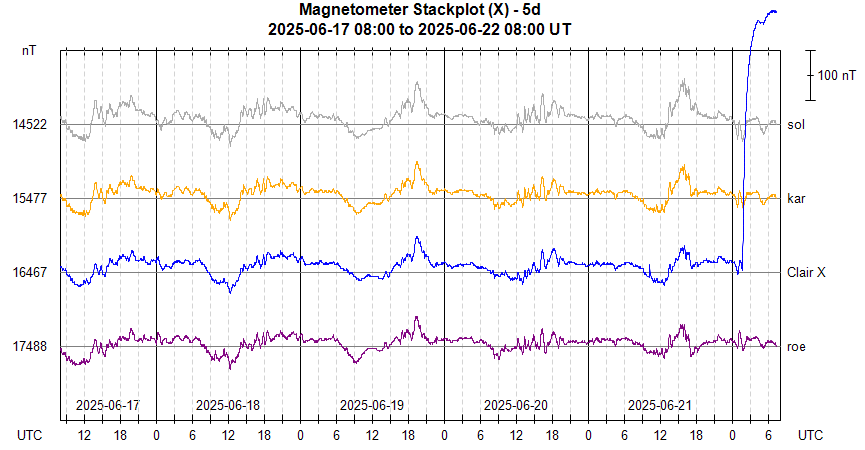
9) 2025-06-22 - X,Y,Z Axes Anomaly
-
Beginning at around 01:40 on 2025-06-22 there was a major upwards
shift in X readings (+490nT)
- This was accompanied by smaller downwards
shifts in Y and Z readings (-145nT & -100nT respectively).
- The change
occurred over for some 2.5 hours in total but was sharpest during the
initial 10-15 mins. There were no spikes per se.
- This anomaly
came just 15.5 hours after the SAM III unit was restarted following
anomalous shifts in y readings on 2025-06-20.
- An initial possibility
was that the event was associated with a period of heavy rain that occurred
the same night, as a strong correlation to rain events has previously been identified,
however it this case the data shows the magnetometer anomaly started 30
minutes before the heavy rain event.
|
Review |
SAM III
| Site Prep
| Assembly
Design |
Parts
Assembly | Testing |
Final
Assembly |
|
Installation
|
Commissioning |
Remedial
Fix |
Operation |
Anomalies |
GA Tool |
Remedial Fix
2 |
Back to Top
| This Web Page: | Notes - Session 1329 (2025-05-25) |
| Last Updated : | 2025-07-05 |
| Site Owner : | David Richards |
| Home Page : | David's Astronomy Web Site |
